1957 West German federal election
Federal elections were held in West Germany on 15 September 1957 to elect the members of the third Bundestag. The Christian Democratic Union and its longtime ally, the Christian Social Union in Bavaria, won a sweeping victory, taking 270 seats in the Bundestag to win the first – and to date, only – absolute majority for a single German parliamentary group in a free election.
| |||||||||||||||||||||||||||||||||||||||||||||||||||||||||||
All 497 seats in the Bundestag[lower-alpha 1] 249 seats needed for a majority | |||||||||||||||||||||||||||||||||||||||||||||||||||||||||||
|---|---|---|---|---|---|---|---|---|---|---|---|---|---|---|---|---|---|---|---|---|---|---|---|---|---|---|---|---|---|---|---|---|---|---|---|---|---|---|---|---|---|---|---|---|---|---|---|---|---|---|---|---|---|---|---|---|---|---|---|
| Registered | 35,400,923 | ||||||||||||||||||||||||||||||||||||||||||||||||||||||||||
| Turnout | 31,072,894 (87.8%) | ||||||||||||||||||||||||||||||||||||||||||||||||||||||||||
| |||||||||||||||||||||||||||||||||||||||||||||||||||||||||||
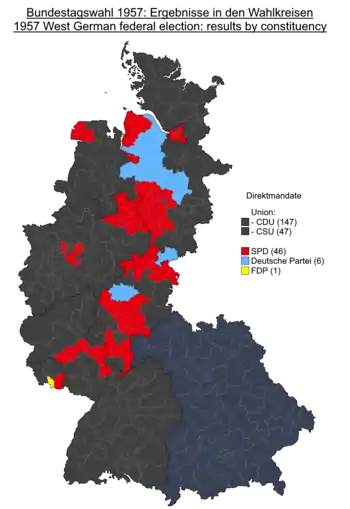 Results by constituency for the first votes. Grey denotes seats won by the CDU/CSU; red denotes seats won by the SPD; light blue denotes seats won by the German Party; yellow denotes the seat won by the FDP. | |||||||||||||||||||||||||||||||||||||||||||||||||||||||||||
| |||||||||||||||||||||||||||||||||||||||||||||||||||||||||||
.jpg.webp)
 |
|---|
|
This was the first West German federal election to take place in the Saarland, which – as Saar protectorate – had been a separate entity under French control between 1946 and 1956.
Campaign
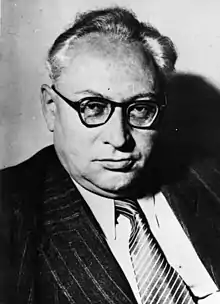
Federal Chancellor Adenauer had some solid advantages over his Social Democratic opponent, Erich Ollenhauer; West Germany had become fully sovereign in 1955 and had joined the European Economic Community in March 1957. Its economy was growing steadily with very low unemployment, and most West Germans felt more prosperous and more secure than in 1949 or 1953. Although the West German economic growth was more directly enhanced by the social market economy policies of Economics Minister Ludwig Erhard, many West German voters gave Adenauer the credit for it.[1][2]
Results
The All-German Bloc lost all of their seats, but the ideologically similar German Party maintained theirs. The 1957 election was the last time that a right-wing populist party would return members to the Bundestag until Alternative for Germany's entrance in 2017.
 | ||||||||||||||
|---|---|---|---|---|---|---|---|---|---|---|---|---|---|---|
| Party | Constituency | Party list | Total seatsa |
+/– | ||||||||||
| Votes | % | Seats | Votes | % | Seats | |||||||||
| Christian Democratic Union (CDU) | 11,975,400 | 39.7 | 147 | 11,875,339 | 39.7 | 68 | 215 | +24 | ||||||
| Social Democratic Party (SPD) | 9,651,669 | 32.0 | 46 | 9,495,571 | 31.8 | 123 | 169 | +18 | ||||||
| Christian Social Union (CSU) | 3,186,150 | 10.6 | 47 | 3,133,060 | 10.5 | 8 | 55 | +3 | ||||||
| Free Democratic Party (FDP) | 2,276,234 | 7.5 | 1 | 2,307,135 | 7.7 | 40 | 41 | −7 | ||||||
| All-German Bloc/League of Expellees and Deprived of Rights (GB/BHE) | 1,324,636 | 4.4 | 0 | 1,374,066 | 4.6 | 0 | 0 | −27 | ||||||
| German Party (DP) | 1,062,293 | 3.5 | 6 | 1,007,282 | 3.4 | 11 | 17 | +2 | ||||||
| Deutsche Reichspartei (DRP) | 290,622 | 1.0 | 0 | 308,564 | 1.0 | 0 | 0 | 0 | ||||||
| Federalist Union (FU) | 295,533 | 1.0 | 0 | 254,322 | 0.9 | 0 | 0 | New | ||||||
| Alliance of Germans (BdD) | 37,329 | 0.1 | 0 | 58,725 | 0.2 | 0 | 0 | New | ||||||
| German Middle Class (Mittelstand) | 3,024 | 0.0 | 0 | 36,592 | 0.1 | 0 | 0 | New | ||||||
| South Schleswig Voters' Association (SSW) | 33,463 | 0.1 | 0 | 32,262 | 0.1 | 0 | 0 | 0 | ||||||
| German Community (DG) | 16,410 | 0.1 | 0 | 17,490 | 0.1 | 0 | 0 | New | ||||||
| Patriotic Union (VU) | 2,250 | 0.0 | 0 | 5,020 | 0.0 | 0 | 0 | 0 | ||||||
| Party of the Good Germans (PdgD) | 356 | 0.0 | 0 | – | – | – | 0 | 0 | ||||||
| Independents and voter groups | 845 | 0.0 | 0 | – | – | – | 0 | 0 | ||||||
| Valid votes | 30,156,214 | 97.0 | – | 29,905,428 | 96.2 | – | – | – | ||||||
| Invalid/blank votes | 916,680 | 3.0 | – | 1,167,466 | 3.8 | – | – | – | ||||||
| Total votes | 31,072,894 | 100.0 | 247 | 31,072,894 | 100.0 | 250 | 497 | +10 | ||||||
| Registered voters/turnout | 35,400,923 | 87.8 | – | 35,400,923 | 87.8 | – | – | – | ||||||
| Source: Bundeswahlleiter | ||||||||||||||
- ^a – excludes the non-voting delegates for West Berlin (12 SPD, 7 CDU, 3 FDP, 1 FVP).
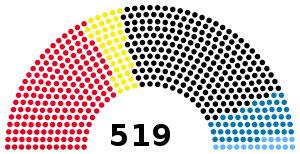
| 270 | 17 | 169 | 41 |
| CDU/CSU | DP | SPD | FDP |
Constituency seats
| State | Total seats |
Seats won | ||||
|---|---|---|---|---|---|---|
| CDU | CSU | SPD | DP | FDP | ||
| Baden-Württemberg | 33 | 32 | 1 | |||
| Bavaria | 47 | 47 | ||||
| Bremen | 3 | 3 | ||||
| Hamburg | 8 | 1 | 7 | |||
| Hesse | 22 | 11 | 10 | 1 | ||
| Lower Saxony | 34 | 21 | 8 | 5 | ||
| North Rhine-Westphalia | 66 | 53 | 13 | |||
| Rhineland-Palatinate | 15 | 12 | 3 | |||
| Saarland | 5 | 3 | 1 | 1 | ||
| Schleswig-Holstein | 14 | 14 | ||||
| Total | 247 | 147 | 47 | 46 | 6 | 1 |
List seats
| State | Total seats |
Seats won | ||||
|---|---|---|---|---|---|---|
| SPD | CDU | FDP | DP | CSU | ||
| Baden-Württemberg | 34 | 17 | 5 | 11 | 1 | |
| Bavaria | 35 | 25 | 4 | 6 | ||
| Bremen | 3 | 2 | 1 | |||
| Hamburg | 11 | 2 | 6 | 2 | 1 | |
| Hesse | 24 | 9 | 9 | 4 | 2 | |
| Lower Saxony | 27 | 14 | 6 | 4 | 3 | |
| North Rhine-Westphalia | 88 | 41 | 34 | 11 | 2 | |
| Rhineland-Palatinate | 16 | 7 | 6 | 3 | ||
| Saarland | 3 | 1 | 2 | |||
| Schleswig-Holstein | 9 | 7 | 1 | 1 | ||
| Total | 250 | 123 | 68 | 40 | 11 | 8 |
Aftermath
Konrad Adenauer led the CDU-CSU coalition to a landslide victory. The CDU-CSU won an outright majority—to date, the only time a German party has been elected to a majority government in a free election (the CDU and CSU sit as a single bloc in the Bundestag).
Notes
| Wikimedia Commons has media related to 1957 Germany Bundestagswahl. |
- As well as the 22 non-voting delegates for West Berlin, elected by the West Berlin Legislature.
- As well as 7 non-voting delegates for West Berlin.
- As well as 12 non-voting delegates for West Berlin.
- As well as 3 non-voting delegates for West Berlin.
References
- Erling Bjöl, Grimberg's History of the Nations, volume 23: The Rich West, "A Giant Dwarf: West Germany," Helsinki: WSOY, 1985
- Dennis L. Bark and David R. Gress, A History of West Germany, volume 1: 1945–1963: From Shadow to Substance, London, UK: Basil Blackwell, 1989
| Parliamentary elections | |
|---|---|
| Presidential elections | |
| European elections | |
| Referendums | |
| |