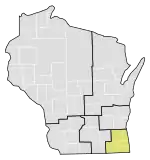
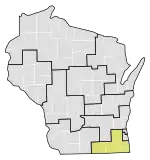
Wisconsin's 1st congressional district
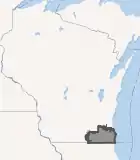
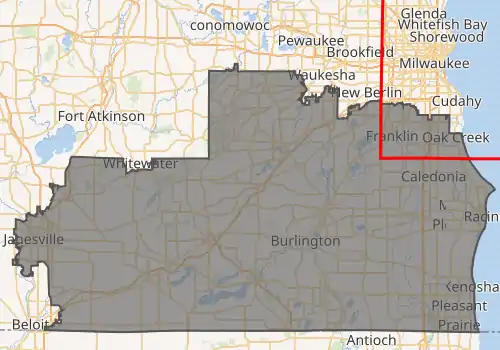
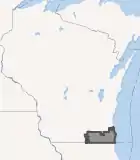
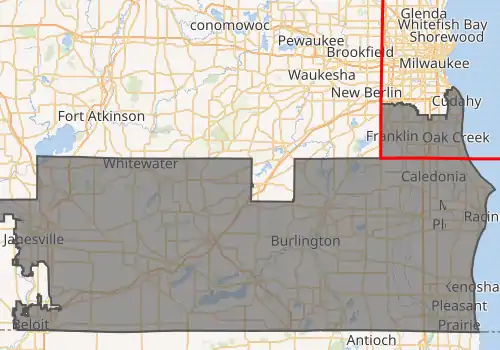
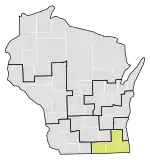
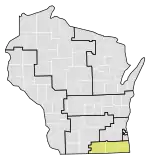
Wisconsin's 1st congressional district is a congressional district of the United States House of Representatives in southeastern Wisconsin, covering Kenosha County, Racine County, and most of Walworth County, as well as portions of Rock County, Waukesha County, and Milwaukee County. The district's current Representative is Republican Bryan Steil.
| Wisconsin's 1st congressional district | |||
|---|---|---|---|
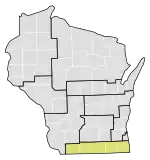
Interactive map of district boundaries, with Milwaukee County highlighted in red. In the 2020 redistricting cycle, the district is moved out of Waukesha County and East Troy, in exchange for cities such as Beloit, South Milwaukee, and most of Whitewater. | |||
| Representative |
| ||
| Area | 1,679.95 sq mi (4,351.1 km2) | ||
| Distribution |
| ||
| Population (2019) | 721,691[1] | ||
| Median household income | $68,695[2] | ||
| Ethnicity | |||
| Cook PVI | R+7[4] | ||
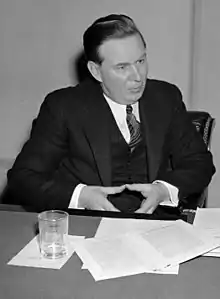
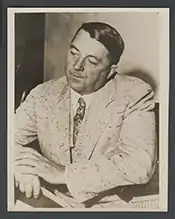
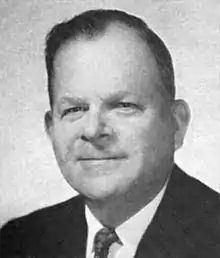
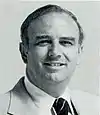
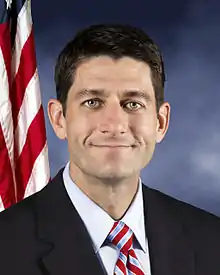
Among the district's previous representatives are U.S. Secretary of Defense Les Aspin and Speaker of the House and 2012 Vice Presidential-nominee Paul Ryan.
A slightly Republican-leaning district, it was carried by George W. Bush in 2004 with 53%; the district voted for Barack Obama over John McCain in 2008, 51.40–47.45% and the district voted for Mitt Romney over Barack Obama in 2012, 52.12%–47.88%.[5] It stayed Republican in 2016, with a majority of voters polling for Donald Trump.[6]
Recent election results from statewide races
Currently, it is a swing district that leans Republican.
| Year | Office | Results |
|---|---|---|
| 2000 | President | Al Gore 49% – George W. Bush 47% |
| 2004 | President | George W. Bush 54% – John Kerry 46% |
| 2008 | President | Barack Obama 51% – John McCain 48% |
| 2012 | President | Mitt Romney 52% – Barack Obama 47% |
| 2016 | President | Donald Trump 53% – Hillary Clinton 42% |
| Senate | Ron Johnson 56% – Russ Feingold 42% | |
| 2018 | Senate | Leah Vukmir 50% – Tammy Baldwin 49% |
| 2020 | President | Donald Trump 53% – Joe Biden 44% |
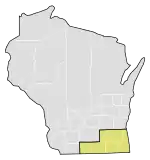
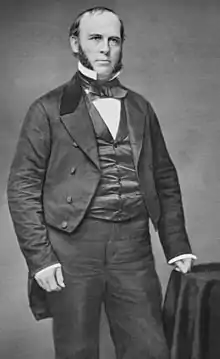
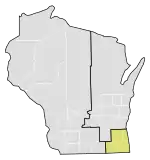
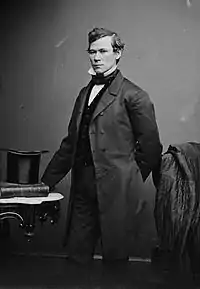
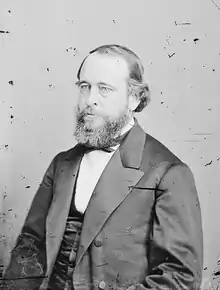
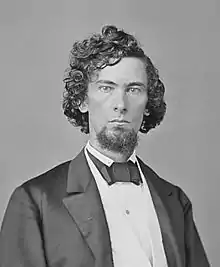
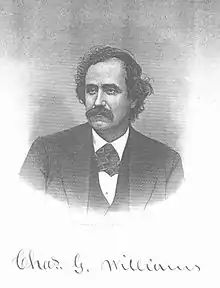
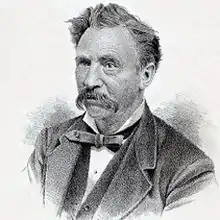
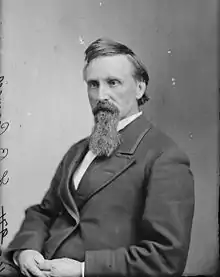
List of members representing the district
.jpg.webp)
.jpg.webp)
.jpg.webp)

.jpg.webp)
.jpg.webp)
.jpg.webp)
.jpg.webp)


Electoral history
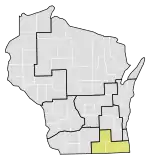
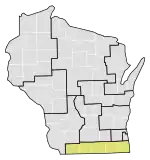
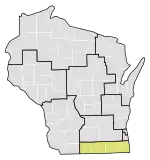
2002 district boundaries (2002–2011)
| Year | Date | Elected | Defeated | Total | Plurality | ||||||
|---|---|---|---|---|---|---|---|---|---|---|---|
| 2002[7] | November 5 | Paul Ryan (inc) | Republican | 140,176 | 67.19% | Jeffrey C. Thomas | Dem. | 63,895 | 30.63% | 208,613 | 76,281 |
| George Meyers | Lib. | 4,406 | 2.11% | ||||||||
| 2004[8] | November 2 | Paul Ryan (inc) | Republican | 233,372 | 65.37% | Jeffrey C. Thomas | Dem. | 116,250 | 32.57% | 356,976 | 117,122 |
| Norman Aulabaugh | Ind. | 4,252 | 1.19% | ||||||||
| Don Bernau | Lib. | 2,936 | 0.82% | ||||||||
| 2006[9] | November 7 | Paul Ryan (inc) | Republican | 161,320 | 62.63% | Jeffrey C. Thomas | Dem. | 95,761 | 37.17% | 257,596 | 65,559 |
| 2008[10] | November 4 | Paul Ryan (inc) | Republican | 231,009 | 63.97% | Marge Krupp | Dem. | 125,268 | 34.69% | 361,107 | 105,741 |
| Joseph Kexel | Lib. | 4,606 | 1.28% | ||||||||
| 2010[11] | November 2 | Paul Ryan (inc) | Republican | 179,819 | 68.21% | John Heckenlively | Dem. | 79,363 | 30.10% | 263,627 | 100,456 |
| Joseph Kexel | Lib. | 4,311 | 1.64% | ||||||||
2011 district boundaries (2012–2021)
| Year | Date | Elected | Defeated | Total | Plurality | ||||||
|---|---|---|---|---|---|---|---|---|---|---|---|
| 2012[12] | November 6 | Paul Ryan (inc) | Republican | 200,423 | 54.90% | Rob Zerban | Dem. | 158,414 | 43.39% | 365,058 | 42,009 |
| Keith Deschler | Ind. | 6,054 | 1.66% | ||||||||
| 2014[13] | November 4 | Paul Ryan (inc) | Republican | 182,316 | 63.27% | Rob Zerban | Dem. | 105,552 | 36.63% | 288,170 | 76,764 |
| Keith Deschler (write-in) | Ind. | 29 | 0.01% | ||||||||
| 2016[14] | November 8 | Paul Ryan (inc) | Republican | 230,072 | 64.95% | Ryan Solen | Dem. | 107,003 | 30.21% | 354,245 | 123,069 |
| Spencer Zimmerman | Ind. | 9,429 | 2.66% | ||||||||
| Jason Lebeck | Lib. | 7,486 | 2.11% | ||||||||
| 2018[15] | November 6 | Bryan Steil | Republican | 177,492 | 54.56% | Randy Bryce | Dem. | 137,508 | 42.27% | 325,317 | 39,984 |
| Ken Yorgan | Ind. | 10,006 | 3.08% | ||||||||
| Joseph Kexel (write-in) | Ind. | 7 | 0.00% | ||||||||
| 2020[16] | November 3 | Bryan Steil (inc) | Republican | 238,271 | 59.31% | Roger Polack | Dem. | 163,170 | 40.61% | 401,754 | 75,101 |
References
- "My Congressional District". U.S. Census Bureau. Retrieved March 19, 2018.
- Center for New Media & Promotion (CNMP), US Census Bureau. "My Congressional District". www.census.gov.
- "Census profile: Congressional District 1, WI". Census Reporter.
- "Introducing the 2021 Cook Political Report Partisan Voter Index". The Cook Political Report. April 15, 2021. Retrieved April 15, 2021.
- "Presidential Canvass Results".
- "White working-class voters flipped Wisconsin red". Retrieved June 29, 2018.
- Results of Fall General Election - 11/05/2002 (PDF) (Report). Wisconsin State Elections Board. December 2, 2002. p. 3. Retrieved March 5, 2022.
- Results of Fall General Election - 11/02/2004 (PDF) (Report). Wisconsin State Elections Board. December 1, 2004. p. 2. Retrieved March 5, 2022.
- Results of Fall General Election - 11/07/2006 (PDF) (Report). Wisconsin State Elections Board. December 5, 2006. p. 3. Retrieved March 5, 2022.
- Results of Fall General Election - 11/04/2008 (PDF) (Report). Wisconsin State Elections Board. December 1, 2008. p. 2. Retrieved March 5, 2022.
- 2010 Fall General Election Results Summary (PDF) (Report). Wisconsin Government Accountability Board. December 1, 2010. p. 3. Retrieved March 5, 2022.
- Canvass Results for 2012 Presidential and General Election - 11/6/2012 (PDF) (Report). Wisconsin Government Accountability Board. December 26, 2012. p. 2. Retrieved March 5, 2022.
- Canvass Results for 2014 General Election - 11/4/2014 (PDF) (Report). Wisconsin Government Accountability Board. November 26, 2014. p. 3. Retrieved March 5, 2022.
- Canvass Results for 2016 General Election - 11/8/2016 (PDF) (Report). Wisconsin Elections Commission. December 22, 2016. p. 3. Retrieved March 5, 2022.
- Canvass Results for 2018 General Election - 11/6/2018 (PDF) (Report). Wisconsin Elections Commission. February 22, 2019. p. 3. Retrieved March 5, 2022.
- Canvass Results for 2020 General Election - 11/3/2020 (PDF) (Report). Wisconsin Elections Commission. November 18, 2020. p. 2. Retrieved March 5, 2022.
- Martis, Kenneth C. (1989). The Historical Atlas of Political Parties in the United States Congress. New York: Macmillan Publishing Company.
- Martis, Kenneth C. (1982). The Historical Atlas of United States Congressional Districts. New York: Macmillan Publishing Company.
- Congressional Biographical Directory of the United States 1774–present