2000 United States presidential election in Maine
The 2000 United States presidential election in Maine took place on November 7, 2000, and was part of the 2000 United States presidential election. Maine is one of two states in the U.S. that instead of all of the state's four electors of the Electoral College to vote based upon the statewide results of the voters, two of the individual electors vote based on their congressional district because Maine has two congressional districts. The other two electors vote based upon the statewide results.
| |||||||||||||||||||||||||||||||||
| |||||||||||||||||||||||||||||||||
 County Results
| |||||||||||||||||||||||||||||||||
| |||||||||||||||||||||||||||||||||


| Elections in Maine |
|---|
 |
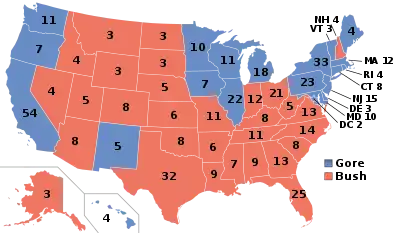
Democratic nominee Vice President Al Gore won the state with 49.09% of the vote over Republican Governor of Texas George W. Bush, who received 43.97%.[1] Maine is the only state besides Nebraska that can split its electoral votes between different candidates, and it did in 2016 and 2020, awarding one electoral vote from the second Congressional district to Donald Trump each time despite his losing the state overall. The last Republican to carry Maine at large was Bush's father, George H. W. Bush, in 1988. As of the 2020 presidential election, this is the last election in which Waldo County and Lincoln County voted for the Republican candidate.
Results
Statewide
| 2000 United States presidential election in Maine[2] | |||||
|---|---|---|---|---|---|
| Party | Candidate | Votes | Percentage | Electoral votes | |
| Democratic | Al Gore | 319,951 | 49.09% | 4 | |
| Republican | George W. Bush | 286,616 | 43.97% | 0 | |
| Green | Ralph Nader | 37,127 | 5.70% | 0 | |
| Reform | Pat Buchanan | 4,443 | 0.68% | 0 | |
| Libertarian | Harry Browne | 3,074 | 0.47% | 0 | |
| Constitution | Howard Phillips | 579 | 0.09% | 0 | |
| Write-in | 27 | <0.01% | — | ||
| Totals | 651,817 | 100.00% | 4 | ||
| Voter turnout | 67% | -5% | |||
Congressional District
| Maine's 1st congressional district | ||
| Candidate | # of Votes | % of Votes |
|---|---|---|
| Al Gore | 176,293 | 50.52% |
| George W. Bush | 148,618 | 42.59% |
| Maine's 2nd congressional district | ||
| Candidate | # of Votes | % of Votes |
|---|---|---|
| Al Gore | 143,658 | 47.43% |
| George W. Bush | 137,998 | 45.56% |
Results Breakdown
By county
| County | Albert Arnold Gore Jr.
Democratic |
George Walker Bush
Republican |
Ralph Nader
Green |
Various candidates
Other parties |
Margin | Total Votes | |||||
|---|---|---|---|---|---|---|---|---|---|---|---|
| % | # | % | # | % | # | % | # | # | % | ||
| Androscoggin | 26,251 | 53.31% | 19,948 | 40.51% | 2,388 | 4.85% | 658 | 1.34% | 6,303 | 12.80% | 49,245 |
| Aroostook | 17,196 | 48.93% | 16,555 | 47.11% | 1,055 | 3.00% | 337 | 0.96% | 641 | 1.82% | 35,143 |
| Cumberland | 74,203 | 52.03% | 58,543 | 41.05% | 8,576 | 6.01% | 1,298 | 0.91% | 15,660 | 10.98% | 142,620 |
| Franklin | 7,593 | 49.15% | 6,459 | 41.81% | 1,115 | 7.22% | 281 | 1.82% | 1,134 | 7.34% | 15,448 |
| Hancock | 12,983 | 45.44% | 12,732 | 44.56% | 2,513 | 8.79% | 346 | 1.21% | 251 | 0.88% | 28,574 |
| Kennebec | 31,198 | 52.96% | 23,967 | 40.69% | 2,955 | 5.02% | 787 | 1.34% | 7,231 | 12.28% | 58,907 |
| Knox | 9,453 | 46.11% | 8,968 | 43.74% | 1,810 | 8.83% | 270 | 1.32% | 485 | 2.37% | 20,501 |
| Lincoln | 8,634 | 43.89% | 9,457 | 48.08% | 1,323 | 6.73% | 257 | 1.31% | -823 | -4.18% | 19,671 |
| Oxford | 13,649 | 49.65% | 11,835 | 43.05% | 1,509 | 5.49% | 500 | 1.82% | 1,814 | 6.60% | 27,493 |
| Penobscot | 32,868 | 44.90% | 35,620 | 48.66% | 3,772 | 5.15% | 946 | 1.29% | -2,752 | -3.76% | 73,206 |
| Piscataquis | 3,745 | 40.46% | 4,845 | 52.34% | 471 | 5.09% | 195 | 2.11% | -1,100 | -11.88% | 9,256 |
| Sagadahoc | 8,844 | 48.05% | 8,052 | 43.75% | 1,278 | 6.94% | 232 | 1.26% | 792 | 4.30% | 18,406 |
| Somerset | 11,538 | 48.17% | 10,684 | 44.61% | 1,239 | 5.17% | 490 | 2.05% | 854 | 3.57% | 23,951 |
| Waldo | 8,477 | 44.29% | 8,689 | 45.40% | 1,690 | 8.83% | 282 | 1.47% | -212 | -1.11% | 19,138 |
| Washington | 6,701 | 42.66% | 7,958 | 50.66% | 802 | 5.11% | 247 | 1.57% | -1,257 | -8.00% | 15,708 |
| York | 46,618 | 49.31% | 42,304 | 44.74% | 4,631 | 4.90% | 997 | 1.05% | 4,314 | 4.56% | 94,550 |
| Total | 319,951 | 49.09% | 286,616 | 43.97% | 37,127 | 5.70% | 8,123 | 1.25% | 33,335 | 5.11% | 651,817 |
References
- "United States Presidential Election Results".
- "2000 Presidential General Election Results - Maine" (HTML). Dave Leip's Atlas of U.S. Presidential Elections. 2001. Retrieved 2009-03-21.
- "General Election Tabulations November 7, 2000-President of the United States". Archived from the original on 6 September 2012.
| Presidential elections | |||||
|---|---|---|---|---|---|
| Senate elections |
| ||||
| House elections | |||||
| Gubernatorial elections |
| ||||
| Legislative elections |
| ||||
| Referendums | |||||
| |
|