2008 United States presidential election in Kentucky
The 2008 United States presidential election in Kentucky took place on November 4, 2008, and was part of the 2008 United States presidential election. Voters chose eight representatives, or electors to the Electoral College, who voted for president and vice president.
| ||||||||||||||||||||||||||
| Turnout | 64.04%[1] | |||||||||||||||||||||||||
|---|---|---|---|---|---|---|---|---|---|---|---|---|---|---|---|---|---|---|---|---|---|---|---|---|---|---|
| ||||||||||||||||||||||||||
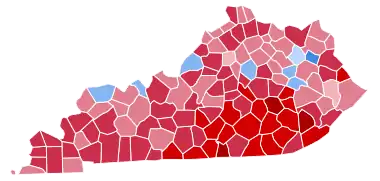 County Results
| ||||||||||||||||||||||||||
| ||||||||||||||||||||||||||
| Elections in Kentucky |
|---|
 |
|
|
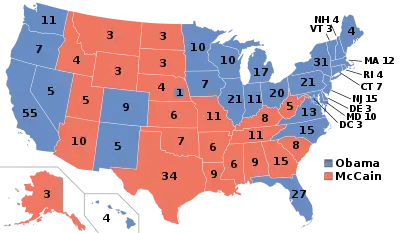
Kentucky was won by Republican nominee John McCain by a 16.23% margin of victory. Prior to the election, all 17 news organizations considered this a state McCain would win, or otherwise a red state. In the primaries, Hillary Clinton slightly defeated McCain in hypothetical polls for the Bluegrass State. Once Barack Obama secured the Democratic nomination, Kentucky was reclassified as safe for the GOP. In the end, Kentucky voted for McCain with 57.40% of the vote. Obama did, however, improve on John Kerry's performance by two points. This was the first time since 1960 where Kentucky did not vote for the winning candidate in a presidential election. This was the first time ever in which Kentucky voted more Republican than neighboring Indiana. This was also the first time ever that Floyd and Knott Counties voted for the Republican candidate, as well as the first time since 1908 that Breathitt County voted for the Republican candidate.
As of 2020, this is the last time a Democrat won over 40% of the vote as a presidential candidate in Kentucky.
Campaign
Predictions
There were 16 news organizations who made state-by-state predictions of the election. Here are their last predictions before election day:
| Source | Ranking |
|---|---|
| D.C. Political Report[2] | Likely R |
| Cook Political Report[3] | Solid R |
| The Takeaway[4] | Solid R |
| Electoral-vote.com[5] | Solid R |
| Washington Post[6] | Solid R |
| Politico[7] | Solid R |
| RealClearPolitics[8] | Solid R |
| FiveThirtyEight[6] | Solid R |
| CQ Politics[9] | Solid R |
| The New York Times[10] | Solid R |
| CNN[11] | Safe R |
| NPR[6] | Solid R |
| MSNBC[6] | Solid R |
| Fox News[12] | Likely R |
| Associated Press[13] | Likely R |
| Rasmussen Reports[14] | Safe R |
Polling
McCain won every pre-election poll, almost all of them by a double-digit margin and with at least 49% of the vote. The final 3 polls averaged McCain leading 56% to 41%.[15]
Fundraising
John McCain raised a total of $1,220,017. Barack Obama raised $2,394,198.[16]
Analysis
Since 1964, Kentucky has only gone Democratic three times--Jimmy Carter in 1976 and Bill Clinton in 1992 and 1996, both of whom were White Anglo Saxon Protestants (WASPs) from the South, whereas Obama was an African American "big-city liberal" from Chicago. (Similar socio-cultural dynamics existed in other Southern and Appalachian states with a large ancestral Democratic base, such as Tennessee, West Virginia, and Arkansas.)
In the 2008 primary, exits polls conducted found that 30 percent of Clinton supporters opted not to vote for Obama in the general election, 40% would vote McCain and the rest would support Obama in the general election. Several counties in the southeastern part of the state swung Republican and went to McCain as solidly Democratic Floyd and Knott counties voted Republican for the first time ever, and Breathitt County voted Republican for the first time since 1908. Obama decided to not spend campaign funds on Kentucky and instead went to more viable battleground states like North Carolina and Indiana instead. McCain won Kentucky by a margin of 16.22 points on election day and performed slightly worse than George Bush in 2004. Obama improved upon Kerry's performance in big cities and urban areas while McCain improved upon Bush in rural areas. Kentucky was the first state called for McCain an hour before Vermont was called for Obama.
At the same time, incumbent Republican U.S. Senator Mitch McConnell, who also served as Senate Minority Leader at the time, was just narrowly reelected with 52.97% of the vote to Democrat Bruce Lunsford's 47.03%. Republicans also held onto an open seat vacated by Ron Lewis in Kentucky's 2nd Congressional District. At the state level, however, Democrats picked up two seats in the Kentucky House of Representatives.
As of the 2020 presidential election, this is the last election in which Rowan County, Hancock County, Menifee County, Wolfe County, and Henderson County voted for the Democratic candidate.
Results
| United States presidential election in Kentucky, 2008 | ||||||
|---|---|---|---|---|---|---|
| Party | Candidate | Running mate | Votes | Percentage | Electoral votes | |
| Republican | John McCain | Sarah Palin | 1,048,462 | 57.40% | 8 | |
| Democratic | Barack Obama | Joe Biden | 751,985 | 41.17% | 0 | |
| Independent | Ralph Nader | Matt Gonzalez | 15,378 | 0.84% | 0 | |
| Libertarian | Bob Barr | Wayne Allyn Root | 5,989 | 0.33% | 0 | |
| Constitution | Chuck Baldwin | Darrell Castle | 4,694 | 0.26% | 0 | |
| Totals | 1,826,508 | 100.00% | 8 | |||
| Voter turnout (Voting age population) | 57.5% | |||||
Results breakdown
By county
| County | Barack H. Obama | John S. McCain | Other | Margin | Total | ||||
|---|---|---|---|---|---|---|---|---|---|
| # | % | # | % | # | % | # | % | ||
| Adair | 1,888 | 25.11% | 5,512 | 73.32% | 118 | 1.57% | 3,624 | 48.20% | 7,518 |
| Allen | 2,023 | 27.38% | 5,258 | 71.16% | 108 | 1.46% | 3,235 | 43.78% | 7,389 |
| Anderson | 3,461 | 32.81% | 6,884 | 65.25% | 205 | 1.94% | 3,423 | 32.45% | 10,550 |
| Ballard | 1,427 | 35.15% | 2,537 | 62.49% | 96 | 2.36% | 1,110 | 27.34% | 4,060 |
| Barren | 5,434 | 32.33% | 11,133 | 66.24% | 240 | 1.43% | 5,699 | 33.91% | 16,807 |
| Bath | 2,210 | 48.65% | 2,234 | 49.17% | 99 | 2.18% | 24 | 0.53% | 4,543 |
| Bell | 2,782 | 28.99% | 6,681 | 69.61% | 135 | 1.41% | 3,899 | 40.62% | 9,598 |
| Boone | 16,292 | 32.09% | 33,812 | 66.59% | 670 | 1.32% | 17,520 | 34.51% | 50,774 |
| Bourbon | 3,385 | 40.64% | 4,820 | 57.86% | 125 | 1.50% | 1,435 | 17.23% | 8,330 |
| Boyd | 8,886 | 42.99% | 11,429 | 55.30% | 354 | 1.71% | 2,543 | 12.30% | 20,669 |
| Boyle | 4,764 | 37.73% | 7,697 | 60.96% | 165 | 1.31% | 2,933 | 23.23% | 12,626 |
| Bracken | 1,241 | 36.51% | 2,066 | 60.78% | 92 | 2.71% | 825 | 24.27% | 3,399 |
| Breathitt | 2,205 | 43.84% | 2,671 | 53.10% | 154 | 3.06% | 466 | 9.26% | 5,030 |
| Breckinridge | 3,110 | 36.49% | 5,281 | 61.97% | 131 | 1.54% | 2,171 | 25.48% | 8,522 |
| Bullitt | 10,177 | 33.12% | 20,102 | 65.42% | 447 | 1.45% | 9,925 | 32.30% | 30,726 |
| Butler | 1,555 | 29.30% | 3,696 | 69.64% | 56 | 1.06% | 2,141 | 40.34% | 5,307 |
| Caldwell | 2,212 | 35.68% | 3,866 | 62.36% | 121 | 1.95% | 1,654 | 26.68% | 6,199 |
| Calloway | 6,165 | 40.02% | 8,991 | 58.37% | 248 | 1.61% | 2,826 | 18.35% | 15,404 |
| Campbell | 15,619 | 38.77% | 24,045 | 59.68% | 626 | 1.55% | 8,426 | 20.91% | 40,290 |
| Carlisle | 879 | 33.59% | 1,699 | 64.92% | 39 | 1.49% | 820 | 31.33% | 2,617 |
| Carroll | 1,716 | 44.75% | 2,032 | 52.99% | 87 | 2.27% | 316 | 8.24% | 3,835 |
| Carter | 4,314 | 43.97% | 5,252 | 53.53% | 245 | 2.50% | 938 | 9.56% | 9,811 |
| Casey | 1,219 | 20.46% | 4,679 | 78.55% | 59 | 0.99% | 3,460 | 58.08% | 5,957 |
| Christian | 8,822 | 39.15% | 13,515 | 59.97% | 199 | 0.88% | 4,693 | 20.82% | 22,536 |
| Clark | 5,749 | 36.79% | 9,664 | 61.84% | 215 | 1.38% | 3,915 | 25.05% | 15,628 |
| Clay | 1,552 | 21.08% | 5,710 | 77.54% | 102 | 1.39% | 4,158 | 56.46% | 7,364 |
| Clinton | 761 | 18.24% | 3,366 | 80.68% | 45 | 1.08% | 2,605 | 62.44% | 4,172 |
| Crittenden | 1,254 | 31.91% | 2,604 | 66.26% | 72 | 1.83% | 1,350 | 34.35% | 3,930 |
| Cumberland | 697 | 24.92% | 2,056 | 73.51% | 44 | 1.57% | 1,359 | 48.59% | 2,797 |
| Daviess | 19,282 | 44.20% | 23,692 | 54.31% | 648 | 1.49% | 4,410 | 10.11% | 43,622 |
| Edmonson | 1,652 | 31.35% | 3,562 | 67.59% | 56 | 1.06% | 1,910 | 36.24% | 5,270 |
| Elliott | 1,535 | 61.03% | 902 | 35.86% | 78 | 3.10% | -633 | -25.17% | 2,515 |
| Estill | 1,555 | 29.26% | 3,685 | 69.35% | 74 | 1.39% | 2,130 | 40.08% | 5,314 |
| Fayette | 66,040 | 51.74% | 59,884 | 46.92% | 1,713 | 1.34% | -6,156 | -4.82% | 127,637 |
| Fleming | 2,279 | 39.08% | 3,432 | 58.85% | 121 | 2.07% | 1,153 | 19.77% | 5,832 |
| Floyd | 7,530 | 48.09% | 7,741 | 49.43% | 388 | 2.48% | 211 | 1.35% | 15,659 |
| Franklin | 11,767 | 48.87% | 11,911 | 49.47% | 401 | 1.67% | 144 | 0.60% | 24,079 |
| Fulton | 1,226 | 43.58% | 1,530 | 54.39% | 57 | 2.03% | 304 | 10.81% | 2,813 |
| Gallatin | 1,278 | 40.03% | 1,840 | 57.63% | 75 | 2.35% | 562 | 17.60% | 3,193 |
| Garrard | 2,012 | 27.91% | 5,117 | 70.98% | 80 | 1.11% | 3,105 | 43.07% | 7,209 |
| Grant | 3,109 | 35.15% | 5,605 | 63.37% | 131 | 1.48% | 2,496 | 28.22% | 8,845 |
| Graves | 5,843 | 36.17% | 10,056 | 62.25% | 256 | 1.58% | 4,213 | 26.08% | 16,155 |
| Grayson | 3,154 | 31.85% | 6,605 | 66.70% | 144 | 1.45% | 3,451 | 34.85% | 9,903 |
| Green | 1,204 | 23.71% | 3,785 | 74.52% | 90 | 1.77% | 2,581 | 50.82% | 5,079 |
| Greenup | 6,621 | 41.91% | 8,849 | 56.01% | 328 | 2.08% | 2,228 | 14.10% | 15,798 |
| Hancock | 2,128 | 51.49% | 1,924 | 46.55% | 81 | 1.96% | -204 | -4.94% | 4,133 |
| Hardin | 15,650 | 39.13% | 23,896 | 59.75% | 444 | 1.11% | 8,246 | 20.62% | 39,990 |
| Harlan | 2,586 | 26.08% | 7,165 | 72.27% | 163 | 1.64% | 4,579 | 46.19% | 9,914 |
| Harrison | 2,916 | 38.42% | 4,520 | 59.55% | 154 | 2.03% | 1,604 | 21.13% | 7,590 |
| Hart | 2,290 | 33.59% | 4,397 | 64.49% | 131 | 1.92% | 2,107 | 30.90% | 6,818 |
| Henderson | 10,049 | 50.60% | 9,523 | 47.95% | 289 | 1.46% | -526 | -2.65% | 19,861 |
| Henry | 2,724 | 39.38% | 4,081 | 58.99% | 113 | 1.63% | 1,357 | 19.62% | 6,918 |
| Hickman | 812 | 36.09% | 1,406 | 62.49% | 32 | 1.42% | 594 | 26.40% | 2,250 |
| Hopkins | 7,104 | 36.72% | 11,916 | 61.59% | 328 | 1.70% | 4,812 | 24.87% | 19,348 |
| Jackson | 743 | 14.22% | 4,407 | 84.36% | 74 | 1.42% | 3,664 | 70.14% | 5,224 |
| Jefferson | 196,272 | 55.50% | 153,865 | 43.51% | 3,500 | 0.99% | -42,407 | -11.99% | 353,637 |
| Jessamine | 6,236 | 30.85% | 13,710 | 67.83% | 267 | 1.32% | 7,474 | 36.98% | 20,213 |
| Johnson | 2,413 | 28.26% | 5,964 | 69.84% | 162 | 1.90% | 3,551 | 41.59% | 8,539 |
| Kenton | 26,480 | 38.82% | 40,714 | 59.69% | 1,019 | 1.49% | 14,234 | 20.87% | 68,213 |
| Knott | 2,523 | 44.97% | 2,950 | 52.58% | 138 | 2.46% | 427 | 7.61% | 5,611 |
| Knox | 3,074 | 26.99% | 8,150 | 71.56% | 165 | 1.45% | 5,076 | 44.57% | 11,389 |
| LaRue | 1,913 | 30.96% | 4,153 | 67.22% | 112 | 1.81% | 2,240 | 36.26% | 6,178 |
| Laurel | 4,593 | 20.52% | 17,563 | 78.48% | 222 | 0.99% | 12,970 | 57.96% | 22,378 |
| Lawrence | 2,036 | 36.04% | 3,503 | 62.01% | 110 | 1.95% | 1,467 | 25.97% | 5,649 |
| Lee | 752 | 27.12% | 1,978 | 71.33% | 43 | 1.55% | 1,226 | 44.21% | 2,773 |
| Leslie | 766 | 17.42% | 3,574 | 81.28% | 57 | 1.30% | 2,808 | 63.86% | 4,397 |
| Letcher | 2,623 | 31.85% | 5,367 | 65.17% | 245 | 2.98% | 2,744 | 33.32% | 8,235 |
| Lewis | 1,510 | 31.52% | 3,213 | 67.06% | 68 | 1.42% | 1,703 | 35.55% | 4,791 |
| Lincoln | 2,752 | 30.07% | 6,273 | 68.55% | 126 | 1.38% | 3,521 | 38.48% | 9,151 |
| Livingston | 1,622 | 35.31% | 2,890 | 62.92% | 81 | 1.76% | 1,268 | 27.61% | 4,593 |
| Logan | 3,811 | 35.00% | 6,925 | 63.59% | 154 | 1.41% | 3,114 | 28.60% | 10,890 |
| Lyon | 1,577 | 40.91% | 2,220 | 57.59% | 58 | 1.50% | 643 | 16.68% | 3,855 |
| McCracken | 11,285 | 38.12% | 19,043 | 60.57% | 426 | 1.31% | 7,758 | 25.23% | 32,512 |
| McCreary | 2,105 | 45.66% | 2,434 | 52.80% | 71 | 1.54% | 329 | 7.14% | 4,610 |
| McLean | 1,963 | 44.39% | 2,386 | 53.96% | 73 | 1.65% | 423 | 9.57% | 4,422 |
| Madison | 12,392 | 36.07% | 19,694 | 61.02% | 451 | 2.91% | 7,302 | 22.44% | 15,507 |
| Magoffin | 808 | 21.58% | 2,824 | 75.43% | 112 | 2.99% | 2,016 | 53.85% | 3,744 |
| Marion | 2,891 | 40.32% | 4,102 | 57.21% | 177 | 2.47% | 1,211 | 16.89% | 7,170 |
| Marshall | 5,593 | 36.85% | 9,463 | 62.19% | 292 | 0.95% | 3,870 | 25.22% | 30,620 |
| Martin | 1,258 | 23.31% | 4,078 | 75.57% | 60 | 1.11% | 2,820 | 52.26% | 5,396 |
| Mason | 2,891 | 40.60% | 4,102 | 57.60% | 128 | 1.8% | 1,310 | 18.14% | 7,121 |
| Meade | 4,343 | 38.76% | 6,691 | 59.71% | 172 | 1.53% | 2,348 | 20.95% | 11,206 |
| Menifee | 1,276 | 51.27% | 1,155 | 46.40% | 58 | 2.33% | -121 | -4.86% | 2,489 |
| Mercer | 3,159 | 31.40% | 6,781 | 67.41% | 120 | 1.19% | 3,622 | 36.00% | 10,060 |
| Metcalfe | 1,350 | 32.15% | 2,734 | 65.11% | 115 | 2.74% | 1,384 | 32.96% | 4,199 |
| Monroe | 1,067 | 22.87% | 3,537 | 75.82% | 61 | 1.31% | 2,470 | 52.95% | 4,665 |
| Montgomery | 4,234 | 40.98% | 5,947 | 57.56% | 150 | 1.45% | 1,713 | 16.58% | 10,331 |
| Morgan | 1,858 | 42.82% | 2,377 | 54.78% | 104 | 2.40% | 519 | 11.96% | 4,339 |
| Muhlenberg | 6,221 | 48.27% | 6,447 | 50.02% | 221 | 1.71% | 226 | 1.75% | 12,889 |
| Nelson | 7,654 | 42.18% | 10,139 | 55.87% | 353 | 1.95% | 2,485 | 13.69% | 18,146 |
| Nicholas | 1,272 | 42.83% | 1,634 | 55.02% | 64 | 2.15% | 362 | 12.19% | 2,970 |
| Ohio | 4,059 | 40.46% | 5,781 | 57.63% | 192 | 1.91% | 1,722 | 17.17% | 10,032 |
| Oldham | 9,996 | 34.11% | 18,992 | 64.80% | 319 | 1.09% | 8,996 | 30.70% | 29,307 |
| Owen | 1,694 | 35.66% | 2,969 | 62.49% | 88 | 1.85% | 1,275 | 26.84% | 4,751 |
| Owsley | 381 | 22.60% | 1,279 | 75.86% | 26 | 1.54% | 898 | 53.26% | 1,686 |
| Pendleton | 2,027 | 34.94% | 3,676 | 63.36% | 99 | 1.71% | 1,649 | 28.42% | 5,802 |
| Perry | 3,444 | 33.20% | 6,762 | 65.18% | 169 | 1.63% | 3,318 | 31.98% | 10,375 |
| Pike | 9,525 | 42.05% | 12,665 | 55.91% | 463 | 2.04% | 3,140 | 13.86% | 22,653 |
| Powell | 2,065 | 41.28% | 2,867 | 57.32% | 70 | 1.40% | 802 | 16.03% | 5,002 |
| Pulaski | 5,590 | 21.70% | 19,862 | 77.09% | 314 | 1.22% | 14,272 | 55.39% | 25,766 |
| Robertson | 451 | 44.43% | 533 | 52.51% | 31 | 3.05% | 82 | 8.08% | 1,015 |
| Rockcastle | 1,410 | 22.47% | 4,757 | 75.82% | 107 | 1.71% | 3,347 | 53.35% | 6,274 |
| Rowan | 4,074 | 49.96% | 3,907 | 47.92% | 173 | 2.12% | -167 | -2.05% | 8,154 |
| Russell | 1,579 | 21.31% | 5,702 | 76.97% | 127 | 1.71% | 4,123 | 55.66% | 7,408 |
| Scott | 7,712 | 39.09% | 11,782 | 59.72% | 236 | 1.20% | 4,070 | 20.63% | 19,730 |
| Shelby | 6,871 | 37.06% | 11,451 | 61.76% | 218 | 1.18% | 4,580 | 24.70% | 18,540 |
| Simpson | 2,775 | 37.97% | 4,437 | 60.71% | 97 | 1.33% | 1,662 | 22.74% | 7,309 |
| Spencer | 2,519 | 31.30% | 5,378 | 66.82% | 152 | 1.89% | 2,859 | 35.52% | 8,049 |
| Taylor | 3,165 | 29.14% | 7,568 | 69.69% | 127 | 1.17% | 4,403 | 40.54% | 10,860 |
| Todd | 1,543 | 31.23% | 3,336 | 67.52% | 62 | 1.25% | 1,793 | 36.29% | 4,941 |
| Trigg | 2,246 | 34.41% | 4,189 | 64.18% | 92 | 1.41% | 1,943 | 29.77% | 6,527 |
| Trimble | 1,484 | 38.93% | 2,239 | 58.74% | 89 | 2.33% | 755 | 19.81% | 3,812 |
| Union | 2,804 | 46.47% | 3,120 | 51.71% | 110 | 1.82% | 316 | 5.24% | 6,034 |
| Warren | 17,650 | 40.03% | 25,957 | 58.87% | 483 | 1.10% | 8,307 | 18.84% | 44,090 |
| Washington | 1,890 | 35.83% | 3,305 | 62.65% | 80 | 1.52% | 1,415 | 26.82% | 5,275 |
| Wayne | 2,201 | 30.59% | 4,868 | 67.65% | 127 | 1.76% | 2,667 | 37.06% | 7,196 |
| Webster | 2,390 | 43.14% | 3,037 | 54.82% | 113 | 2.04% | 647 | 11.68% | 5,540 |
| Whitley | 3,484 | 25.43% | 10,014 | 73.08% | 205 | 1.50% | 6,530 | 47.65% | 13,703 |
| Wolfe | 1,493 | 50.30% | 1,408 | 47.44% | 67 | 2.26% | -85 | -2.86% | 2,968 |
| Woodford | 5,027 | 40.88% | 7,130 | 57.98% | 140 | 1.14% | 2,103 | 17.10% | 12,297 |
| Total | 751,010 | 41.14% | 1,048,274 | 57.43% | 26,057 | 1.43% | 297,264 | 16.29% | 1,825,341 |
By congressional district
John McCain carried 5 of the state's 6 congressional districts, including one of the two districts held by a Democrat.
| District | McCain | Obama | Representative |
|---|---|---|---|
| 1st | 61.85% | 36.60% | Ed Whitfield |
| 2nd | 60.54% | 38.03% | Ron Lewis (110th Congress) |
| Brett Guthrie (111th Congress) | |||
| 3rd | 43.36% | 55.66% | John Yarmuth |
| 4th | 60.41% | 37.96% | Geoff Davis |
| 5th | 67.01% | 31.24% | Hal Rogers |
| 6th | 55.41% | 43.22% | Ben Chandler |
Electors
Technically the voters of Kentucky cast their ballots for electors: representatives to the Electoral College. Kentucky is allocated 8 electors because it has 6 congressional districts and 2 senators. All candidates who appear on the ballot or qualify to receive write-in votes must submit a list of 8 electors, who pledge to vote for their candidate and his or her running mate. Whoever wins the majority of votes in the state is awarded all 8 electoral votes. Their chosen electors then vote for president and vice president. Although electors are pledged to their candidate and running mate, they are not obligated to vote for them.[19] An elector who votes for someone other than his or her candidate is known as a faithless elector.
The electors of each state and the District of Columbia met on December 15, 2008, to cast their votes for president and vice president. The Electoral College itself never meets as one body. Instead the electors from each state and the District of Columbia met in their respective capitols.
The following were the members of the Electoral College from the state. All 8 were pledged to John McCain and Sarah Palin:[20]
- James Henry Snider
- Walter A. Baker
- Edna M. Fulkerson
- Amy B. Towles
- Nancy Mitchell
- Don Ball
- Robert Gable
- Elizabeth G. Thomas
References
- https://elect.ky.gov/SiteCollectionDocuments/Election%20Statistics/turnout/2006-2010/08gen.pdf
- "D.C.'s Political Report: The complete source for campaign summaries". 2009-01-01. Archived from the original on 2009-01-01. Retrieved 2021-08-23.
- "Presidential". 2015-05-05. Archived from the original on 2015-05-05. Retrieved 2021-08-23.
- "Vote 2008 - The Takeaway - Track the Electoral College vote predictions". 2009-04-22. Archived from the original on 2009-04-22. Retrieved 2021-08-23.
- "Electoral-vote.com: President, Senate, House Updated Daily". electoral-vote.com. Retrieved 2021-08-23.
- Based on Takeaway
- "POLITICO's 2008 Swing State Map - POLITICO.com". www.politico.com. Retrieved 2016-09-22.
- "RealClearPolitics - Electoral Map". Archived from the original on 2008-06-05.
- "CQ Presidential Election Maps, 2008". CQ Politics. Archived from the original on June 14, 2009. Retrieved December 20, 2009.
- Nagourney, Adam; Zeleny, Jeff; Carter, Shan (2008-11-04). "The Electoral Map: Key States". The New York Times. Retrieved May 26, 2010.
- "October – 2008 – CNN Political Ticker - CNN.com Blogs". CNN. 2008-10-31. Retrieved May 26, 2010.
- "Winning The Electoral College". Fox News. April 27, 2010.
- "roadto270". hosted.ap.org. Retrieved 2016-09-22.
- "Election 2008: Electoral College Update - Rasmussen Reports™". www.rasmussenreports.com. Retrieved 2016-09-22.
- Election 2008 Polls - Dave Leip's Atlas of U.S. Presidential Elections
- "Presidential Campaign Finance". Archived from the original on 2009-03-24. Retrieved 2009-08-20.
- "Map: Campaign Ad Spending - Election Center 2008 from CNN.com". CNN. Retrieved May 26, 2010.
- "Map: Campaign Candidate Visits - Election Center 2008 from CNN.com". CNN. Retrieved May 26, 2010.
- "Electoral College". California Secretary of State. Archived from the original on October 30, 2008. Retrieved 2008-11-01.
- Kentucky's electors » Archive » Evening News and Tribune