2004 United States presidential election in Kentucky
The 2004 United States presidential election in Kentucky took place on November 2, 2004, and was part of the 2004 United States presidential election. Voters chose eight representatives, or electors to the Electoral College, who voted for president and vice president.
| ||||||||||||||||||||||||||
| Turnout | 64.74%[1] | |||||||||||||||||||||||||
|---|---|---|---|---|---|---|---|---|---|---|---|---|---|---|---|---|---|---|---|---|---|---|---|---|---|---|
| ||||||||||||||||||||||||||
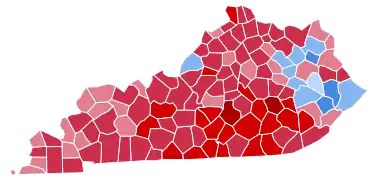 County Results
| ||||||||||||||||||||||||||
| ||||||||||||||||||||||||||
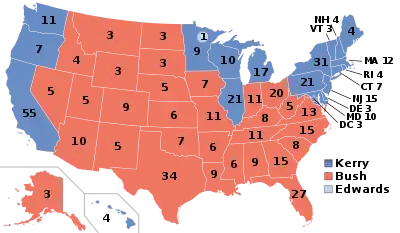
Kentucky was won by incumbent President George W. Bush by a 19.86% margin of victory. Prior to the election, all 12 news organizations considered this a state Bush would win, or otherwise a red state. Bush widened his margin of victory since his victory in 2000 against Al Gore, the former Senator of neighboring Tennessee, by 4.73%. He made his strongest progress in the eastern part of the state and at the border with Virginia. As of 2020, this is the last time that Kentucky has voted to the left of neighboring Indiana, the last election in which Fayette County has voted for the Republican candidate, and the last in which Knott County, Floyd County, Breathitt County, Bath County, Pike County, Carter County, and Magoffin County voted for the Democratic candidate. This was the first time ever that a Republican won a majority in Ballard County.
This victory coincided with a U.S. Senate election, where controversial Republican incumbent Jim Bunning was narrowly reelected over Daniel Mongiardo, most likely due to Bush's landslide victory.
Campaign
Predictions
| Elections in Kentucky |
|---|
 |
|
|
There were 12 news organizations who made state-by-state predictions of the election. Here are their last predictions before election day.[2]
- D.C. Political Report: Solid Republican
- Associated Press: Solid Bush
- CNN: Bush
- Cook Political Report: Solid Republican
- Newsweek: Solid Bush
- New York Times: Solid Bush
- Rasmussen Reports: Bush
- Research 2000: Solid Bush
- Washington Post: Bush
- Washington Times: Solid Bush
- Zogby International: Bush
- Washington Dispatch: Bush
Polling
Bush won every single pre-election poll, and won each by a double-digit margin of victory and with at least 52% of the vote. The final 3 poll averaged Bush leading 57% to 38%.[3]
Results
President George W. Bush easily defeated Massachusetts Senator John F. Kerry in Kentucky, capturing the state's 8 electoral votes. Bush did well throughout the state. Kerry only won a handful of counties. Kerry performed decently in coal country in east Kentucky but Kerry fared poorly in other rural parts of the state. Kerry did win Jefferson County, the most populous county in the state and home of Louisville. However this was not enough to overcome Bush's lead. This race was not close, whereas the concurrent senate race was very tight. As of the 2020 presidential election, this is the last election in which Fayette County voted for the Republican candidate and the last election in which Knott County, Floyd County, Breathitt County, Bath County, Pike County, Carter County, and Magoffin County voted for the Democratic candidate. This was the first time ever that a Republican won a majority in Ballard County.
| United States presidential election in Kentucky, 2004 | |||||
|---|---|---|---|---|---|
| Party | Candidate | Votes | Percentage | Electoral votes | |
| Republican | George W. Bush (incumbent) | 1,069,439 | 59.55% | 8 | |
| Democratic | John Kerry | 712,733 | 39.69% | 0 | |
| Reform | Ralph Nader | 8,856 | 0.49% | 0 | |
| Libertarian | Michael Badnarik | 2,619 | 0.15% | 0 | |
| Constitution | Michael Peroutka | 2,213 | 0.12% | 0 | |
| Totals | 1,795,860 | 100.00% | 8 | ||
| Voter turnout (Voting age population) | 57.5% | ||||
Results breakdown
By county
| County | John F. Kerry | George W. Bush | Other | Margin | Total | ||||
|---|---|---|---|---|---|---|---|---|---|
| # | % | # | % | # | % | # | % | ||
| Adair | 1,764 | 23.7% | 5,628 | 75.6% | 55 | 0.7% | 3,864 | 51.89% | 7,447 |
| Allen | 1,923 | 26.8% | 5,202 | 72.6% | 38 | 0.5% | 3,279 | 45.78% | 7,163 |
| Anderson | 3,141 | 32.7% | 6,363 | 66.3% | 87 | 0.9% | 3,222 | 33.59% | 9,591 |
| Ballard | 1,759 | 42.1% | 2,389 | 57.2% | 29 | 0.7% | 630 | 15.08% | 4,177 |
| Barren | 5,216 | 32.3% | 10,822 | 67.1% | 102 | 0.6% | 5,606 | 34.73% | 16,140 |
| Bath | 2,608 | 53.0% | 2,269 | 46.1% | 42 | 0.9% | -339 | -6.89% | 4,919 |
| Bell | 4,210 | 38.3% | 6,722 | 61.1% | 70 | 0.6% | 2,512 | 22.83% | 11,002 |
| Boone | 12,391 | 27.5% | 32,329 | 71.7% | 362 | 0.8% | 19,938 | 44.23% | 45,082 |
| Bourbon | 3,198 | 38.9% | 4,953 | 60.3% | 66 | 0.8% | 1,755 | 21.36% | 8,217 |
| Boyd | 10,132 | 46.5% | 11,501 | 52.8% | 144 | 0.7% | 1,369 | 6.29% | 21,777 |
| Boyle | 4,646 | 37.2% | 7,764 | 62.2% | 80 | 0.6% | 3,118 | 24.96% | 12,490 |
| Bracken | 1,213 | 33.6% | 2,363 | 65.5% | 34 | 0.9% | 1,150 | 31.86% | 3,610 |
| Breathitt | 3,327 | 56.0% | 2,542 | 42.8% | 75 | 1.3% | -785 | -13.21% | 5,944 |
| Breckinridge | 2,884 | 33.8% | 5,580 | 65.5% | 56 | 0.7% | 2,696 | 31.64% | 8,520 |
| Bullitt | 9,043 | 31.6% | 19,433 | 67.9% | 151 | 0.5% | 10,390 | 36.29% | 28,627 |
| Butler | 1,436 | 25.7% | 4,109 | 73.7% | 33 | 0.6% | 2,673 | 47.92% | 5,578 |
| Caldwell | 2,245 | 35.4% | 4,066 | 64.0% | 38 | 0.6% | 1,821 | 28.68% | 6,349 |
| Calloway | 5,728 | 37.8% | 9,293 | 61.4% | 124 | 0.8% | 3,565 | 23.54% | 15,145 |
| Campbell | 14,253 | 35.5% | 25,540 | 63.6% | 382 | 1.0% | 11,287 | 28.09% | 40,175 |
| Carlisle | 1,102 | 38.7% | 1,734 | 60.9% | 9 | 0.3% | 632 | 22.21% | 2,845 |
| Carroll | 1,688 | 43.3% | 2,175 | 55.8% | 34 | 0.9% | 487 | 12.50% | 3,897 |
| Carter | 5,577 | 50.2% | 5,422 | 48.8% | 118 | 1.1% | -155 | -1.39% | 11,117 |
| Casey | 1,174 | 18.6% | 5,109 | 80.8% | 38 | 0.6% | 3.935 | 62.25% | 6,321 |
| Christian | 6,970 | 33.2% | 13,935 | 66.3% | 110 | 0.5% | 6,965 | 33.14% | 21,015 |
| Clark | 5,661 | 37.0% | 9,540 | 62.3% | 116 | 0.8% | 3,879 | 25.32% | 15,317 |
| Clay | 1,901 | 24.7% | 5,726 | 74.5% | 60 | 0.8% | 3,825 | 49.76% | 7,687 |
| Clinton | 952 | 21.9% | 3,369 | 77.4% | 31 | 0.7% | 2,417 | 55.54% | 4,352 |
| Crittenden | 1,438 | 34.3% | 2,726 | 65.1% | 26 | 0.6% | 1,288 | 30.74% | 4,190 |
| Cumberland | 848 | 26.2% | 2,356 | 72.7% | 35 | 1.1% | 1,508 | 46.56% | 3,239 |
| Daviess | 15,788 | 38.1% | 25,372 | 61.2% | 323 | 0.8% | 9,584 | 23.10% | 41,483 |
| Edmonson | 1,856 | 33.9% | 3,595 | 65.6% | 30 | 0.5% | 1,739 | 31.73% | 5,481 |
| Elliott | 2,064 | 69.8% | 871 | 29.5% | 22 | 0.7% | -1,193 | -40.34% | 2,957 |
| Estill | 1,907 | 34.2% | 3,633 | 65.2% | 35 | 0.6% | 1,726 | 30.96% | 5,575 |
| Fayette | 57,994 | 46.2% | 66,406 | 52.9% | 1,176 | 0.9% | 8,412 | 6.70% | 125,576 |
| Fleming | 2,406 | 38.8% | 3,749 | 60.4% | 48 | 0.8% | 1,343 | 21.65% | 6,203 |
| Floyd | 11,132 | 62.2% | 6,612 | 37.0% | 141 | 0.8% | -4,520 | -25.27% | 17,885 |
| Franklin | 11,620 | 48.1% | 12,281 | 50.9% | 232 | 1.0% | 661 | 2.74% | 24,133 |
| Fulton | 1,340 | 46.4% | 1,527 | 52.8% | 23 | 0.8% | 187 | 6.47% | 2,890 |
| Gallatin | 1,188 | 38.7% | 1,869 | 60.8% | 16 | 0.5% | 681 | 22.16% | 3,073 |
| Garrard | 1,841 | 27.7% | 4,784 | 71.9% | 33 | 0.5% | 2,943 | 44.20% | 6,658 |
| Grant | 2,818 | 31.9% | 5,951 | 67.4% | 55 | 0.6% | 3,133 | 35.51% | 8,824 |
| Graves | 6,206 | 38.2% | 9,903 | 61.0% | 120 | 0.7% | 3,697 | 22.78% | 16,229 |
| Grayson | 2,905 | 28.6% | 7,170 | 70.7% | 68 | 0.7% | 4,265 | 42.05% | 10,143 |
| Green | 1,312 | 25.2% | 3,866 | 74.3% | 28 | 0.5% | 2,554 | 49.06% | 5,206 |
| Greenup | 7,630 | 46.4% | 8,696 | 52.9% | 109 | 0.7% | 1,066 | 6.49% | 16,435 |
| Hancock | 1,709 | 42.4% | 2,286 | 56.7% | 34 | 0.8% | 577 | 14.32% | 4,029 |
| Hardin | 11,507 | 31.6% | 24,627 | 67.6% | 307 | 0.8% | 13,120 | 36.00% | 36,441 |
| Harlan | 4,332 | 39.1% | 6,659 | 60.2% | 79 | 0.7% | 2,327 | 21.02% | 11,070 |
| Harrison | 2,807 | 36.3% | 4,855 | 62.8% | 69 | 0.9% | 2,048 | 26.49% | 7,731 |
| Hart | 2,470 | 36.4% | 4,269 | 62.9% | 45 | 0.7% | 1,799 | 26.52% | 6,784 |
| Henderson | 8,101 | 43.3% | 10,467 | 56.0% | 133 | 0.7% | 2,366 | 12.65% | 18,701 |
| Henry | 2,366 | 36.4% | 4,094 | 63.0% | 39 | 0.6% | 1,728 | 26.59% | 6,499 |
| Hickman | 926 | 39.5% | 1,395 | 59.6% | 21 | 0.9% | 469 | 20.03% | 2,342 |
| Hopkins | 6,420 | 34.1% | 12,314 | 65.4% | 109 | 0.6% | 5,894 | 31.28% | 18,843 |
| Jackson | 769 | 14.9% | 4,369 | 84.4% | 40 | 0.8% | 3,600 | 69.52% | 5,178 |
| Jefferson | 170,158 | 50.4% | 164,566 | 48.8% | 2,626 | 0.8% | -5,592 | -1.66% | 337,350 |
| Jessamine | 5,476 | 29.5% | 12,972 | 69.8% | 132 | 0.7% | 7,496 | 40.34% | 18,580 |
| Johnson | 3,288 | 35.3% | 5,940 | 63.8% | 76 | 0.8% | 2,652 | 28.50% | 9,304 |
| Kenton | 22,834 | 34.0% | 43,664 | 65.1% | 625 | 0.9% | 20,830 | 31.03% | 67,123 |
| Knott | 4,685 | 63.4% | 2,648 | 35.8% | 61 | 0.8% | 2,037 | 27.55% | 7,394 |
| Knox | 3,822 | 31.8% | 8,108 | 67.4% | 98 | 0.8% | 4,286 | 35.63% | 12,028 |
| LaRue | 1,823 | 30.5% | 4,111 | 68.9% | 34 | 0.6% | 2,288 | 38.34% | 5,968 |
| Laurel | 5,297 | 23.8% | 16,819 | 75.5% | 148 | 0.7% | 11,522 | 51.75% | 22,264 |
| Lawrence | 2,705 | 41.5% | 3,755 | 57.7% | 53 | 0.8% | 1,050 | 16.12% | 6,513 |
| Lee | 878 | 30.1% | 2,018 | 69.1% | 24 | 0.8% | 1,140 | 39.04% | 2,920 |
| Leslie | 1,266 | 25.5% | 3,661 | 73.8% | 37 | 0.7% | 2,395 | 48.25% | 4,964 |
| Letcher | 4,192 | 46.2% | 4,801 | 53.0% | 72 | 0.8% | 609 | 6.72% | 9,065 |
| Lewis | 1,667 | 30.4% | 3,778 | 68.9% | 39 | 0.7% | 2,111 | 38.49% | 5,484 |
| Lincoln | 2,796 | 31.5% | 5,996 | 67.7% | 71 | 0.8% | 3,200 | 36.11% | 8,863 |
| Livingston | 2,007 | 42.6% | 2,675 | 56.8% | 24 | 0.5% | 668 | 14.19% | 4,706 |
| Logan | 3,768 | 35.4% | 6,815 | 64.0% | 61 | 0.6% | 3,047 | 28.63% | 10,644 |
| Lyon | 1,769 | 45.1% | 2,132 | 54.3% | 24 | 0.6% | 363 | 9.25% | 3,925 |
| McCracken | 11,361 | 38.1% | 18,218 | 61.1% | 218 | 0.7% | 6,857 | 23.01% | 29,797 |
| McCreary | 1,530 | 26.9% | 4,121 | 72.4% | 42 | 0.7% | 2,591 | 45.51% | 5,693 |
| McLean | 1,823 | 41.1% | 2,584 | 58.3% | 28 | 0.6% | 761 | 17.16% | 4,435 |
| Madison | 11,525 | 37.5% | 18,922 | 61.6% | 260 | 0.8% | 7,397 | 24.09% | 30,707 |
| Magoffin | 2,843 | 49.7% | 2,836 | 49.6% | 39 | 0.7% | -7 | -0.12% | 5,718 |
| Marion | 3,399 | 46.2% | 3,905 | 53.1% | 50 | 0.7% | 506 | 6.88% | 7,354 |
| Marshall | 6,383 | 41.1% | 9,049 | 58.3% | 89 | 0.6% | 2,666 | 17.18% | 15,521 |
| Martin | 1,504 | 33.1% | 2,996 | 66.0% | 39 | 0.9% | 1,492 | 32.87% | 4,539 |
| Mason | 2,644 | 37.3% | 4,381 | 61.9% | 54 | 0.8% | 1,737 | 24.54% | 7,079 |
| Meade | 3,724 | 34.0% | 7,152 | 65.3% | 75 | 0.7% | 3,428 | 31.30% | 10,951 |
| Menifee | 1,284 | 50.8% | 1,215 | 48.1% | 29 | 1.1% | -69 | -2.73% | 2,528 |
| Mercer | 3,224 | 32.1% | 6,745 | 67.3% | 59 | 0.6% | 3,521 | 35.11% | 10,028 |
| Metcalfe | 1,472 | 35.4% | 2,645 | 63.6% | 40 | 1.0% | 1,173 | 28.22% | 4,157 |
| Monroe | 1,158 | 19.8% | 4,657 | 79.7% | 28 | 0.5% | 3,499 | 59.88% | 5,843 |
| Montgomery | 4,506 | 44.0% | 5,647 | 55.2% | 77 | 0.8% | 1,141 | 11.15% | 10,230 |
| Morgan | 2,532 | 48.0% | 2,682 | 50.9% | 58 | 1.1% | 150 | 2.85% | 5,272 |
| Muhlenberg | 6,636 | 49.2% | 6,749 | 50.1% | 94 | 0.7% | 113 | 0.84% | 13,479 |
| Nelson | 6,524 | 38.7% | 10,161 | 60.3% | 159 | 0.9% | 3,637 | 21.59% | 16,844 |
| Nicholas | 1,332 | 43.5% | 1,700 | 55.6% | 27 | 0.9% | 368 | 12.03% | 3,059 |
| Ohio | 3,627 | 36.2% | 6,311 | 62.9% | 90 | 0.9% | 2,684 | 26.77% | 10,028 |
| Oldham | 8,080 | 29.8% | 18,801 | 69.3% | 251 | 0.9% | 10,721 | 39.51% | 27,132 |
| Owen | 1,615 | 34.1% | 3,084 | 65.0% | 42 | 0.9% | 1,469 | 30.99% | 4,741 |
| Owsley | 430 | 21.5% | 1,558 | 77.9% | 11 | 0.6% | 1,128 | 56.43% | 1,999 |
| Pendleton | 1,940 | 32.2% | 4,045 | 67.1% | 40 | 0.7% | 2,105 | 34.94% | 6,025 |
| Perry | 5,400 | 46.3% | 6,187 | 53.1% | 68 | 0.6% | 787 | 6.75% | 11,655 |
| Pike | 14,002 | 52.3% | 12,611 | 47.1% | 157 | 0.6% | -1,391 | -5.20% | 26,770 |
| Powell | 2,249 | 45.3% | 2,687 | 54.2% | 24 | 0.5% | 438 | 8.83% | 4,960 |
| Pulaski | 5,829 | 22.8% | 19,535 | 76.6% | 152 | 0.6% | 13,706 | 53.72% | 25,516 |
| Robertson | 413 | 37.9% | 670 | 61.5% | 7 | 0.6% | 257 | 23.58% | 1,090 |
| Rockcastle | 1,320 | 21.4% | 4,804 | 77.9% | 42 | 0.7% | 3,484 | 56.50% | 6,166 |
| Rowan | 4,556 | 52.3% | 4,063 | 46.7% | 87 | 1.0% | -493 | -5.66% | 8,706 |
| Russell | 1,772 | 22.7% | 6,009 | 76.8% | 40 | 0.5% | 4,237 | 54.17% | 7,821 |
| Scott | 6,325 | 37.1% | 10,600 | 62.2% | 125 | 0.7% | 4,275 | 25.07% | 17,050 |
| Shelby | 5,277 | 32.3% | 10,909 | 66.9% | 127 | 0.8% | 5,632 | 34.52% | 16,313 |
| Simpson | 2,730 | 38.8% | 4,273 | 60.7% | 40 | 0.6% | 1,543 | 21.91% | 7,043 |
| Spencer | 1,970 | 28.9% | 4,816 | 70.6% | 36 | 0.5% | 2,846 | 41.72% | 6,822 |
| Taylor | 2,979 | 28.9% | 7,247 | 70.4% | 69 | 0.7% | 4,268 | 41.46% | 10,295 |
| Todd | 1,491 | 31.4% | 3,242 | 68.2% | 21 | 0.4% | 1,751 | 36.83% | 4,754 |
| Trigg | 2,046 | 33.5% | 4,023 | 65.8% | 42 | 0.7% | 1,977 | 32.35% | 6,111 |
| Trimble | 1,428 | 37.7% | 2,332 | 61.5% | 30 | 0.8% | 904 | 23.85% | 3,790 |
| Union | 2,398 | 40.1% | 3,534 | 59.1% | 45 | 0.8% | 1,136 | 19.01% | 5,977 |
| Warren | 14,326 | 36.1% | 25,100 | 63.2% | 285 | 0.7% | 10,774 | 27.13% | 39,711 |
| Washington | 1,724 | 32.9% | 3,479 | 66.4% | 33 | 0.6% | 1,755 | 33.52% | 5,236 |
| Wayne | 2,616 | 34.0% | 5,027 | 65.4% | 42 | 0.5% | 2,411 | 31.37% | 7,685 |
| Webster | 2,304 | 41.5% | 3,207 | 57.8% | 36 | 0.6% | 903 | 16.28% | 5,547 |
| Whitley | 3,985 | 29.2% | 9,559 | 70.1% | 85 | 0.6% | 5,574 | 40.90% | 13,629 |
| Wolfe | 1,744 | 55.3% | 1,385 | 43.9% | 26 | 0.8% | -359 | -11.38% | 3,155 |
| Woodford | 4,480 | 38.9% | 6,937 | 60.3% | 85 | 0.7% | 2,457 | 21.36% | 11,502 |
| Total | 712,733 | 39.69% | 1,069,439 | 59.55% | 13,688 | 0.76% | 356,706 | 19.86% | 1,795,860 |
By congressional district
Bush won 5 of 6 congressional districts.
| District | Bush | Kerry | Representative |
|---|---|---|---|
| 1st | 63% | 36% | Ed Whitfield |
| 2nd | 65% | 34% | Ron Lewis |
| 3rd | 49% | 51% | Anne Northup |
| 4th | 63% | 36% | Geoff Davis |
| 5th | 61% | 39% | Hal Rogers |
| 6th | 58% | 41% | Ben Chandler |
Electors
Technically the voters of Kentucky cast their ballots for electors: representatives to the Electoral College. Kentucky is allocated 8 electors because it has 6 congressional districts and 2 senators. All candidates who appear on the ballot or qualify to receive write-in votes must submit a list of 8 electors, who pledge to vote for their candidate and his or her running mate. Whoever wins the majority of votes in the state is awarded all 8 electoral votes. Their chosen electors then vote for president and vice president. Although electors are pledged to their candidate and running mate, they are not obligated to vote for them. An elector who votes for someone other than his or her candidate is known as a faithless elector.
The electors of each state and the District of Columbia met on December 13, 2004, to cast their votes for president and vice president. The Electoral College itself never meets as one body. Instead the electors from each state and the District of Columbia met in their respective capitols.
The following were the members of the Electoral College from the state. All 8 were pledged to Bush/Cheney:
- Rachel N. McCubbin
- Keith A. Hall
- Carolyn Cole
- Martha G. Prewitt
- Donald E. Girdler
- Constance M. Gray
- Frank Schwendeman
- Carla T. Bartleman
References
- https://elect.ky.gov/SiteCollectionDocuments/Election%20Statistics/turnout/2001-2005/04gen.pdf
- http://www.dcpoliticalreport.com/members/2004/Pred2.htm#NW
- http://uselectionatlas.org/USPRESIDENT/GENERAL/CAMPAIGN/2004/polls.php?fips=21
- "George W Bush - $374,659,453 raised, '04 election cycle, Republican Party, President".
- "John F Kerry - $345,826,176 raised, '04 election cycle, Democrat Party, President".
- http://www.cnn.com/ELECTION/2004/special/president/campaign.ads/
- http://www.cnn.com/ELECTION/2004/special/president/tracking/10.25.html