2008 United States presidential election in Alabama
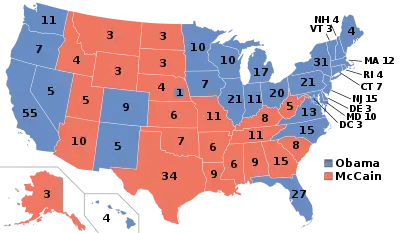
The 2008 United States presidential election in Alabama took place on November 4, 2008, and was part of the 2008 United States presidential election. Voters chose nine representatives, or electors, to the Electoral College, who voted for president and vice president.
| ||||||||||||||||||||||||||
| ||||||||||||||||||||||||||
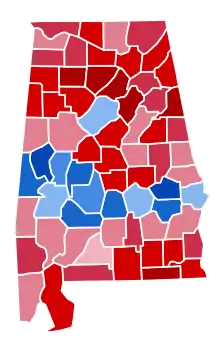 County Results
| ||||||||||||||||||||||||||
| ||||||||||||||||||||||||||
| Elections in Alabama |
|---|
 |
|
|
Alabama was won by Republican nominee John McCain with a 21.58% margin of victory. Prior to the election, 17 news organizations considered this a state McCain would win, or otherwise a red state. Located in the Deep South, Alabama is one of the most conservative states in the country. Republicans have won every presidential election in Alabama since 1980, and the 2008 election was no exception. McCain carried 54 of the state's 67 counties and easily prevailed in the Yellowhammer State. However, Obama improved on Kerry's performance by two points and reduced his margin of defeat by four. Obama also managed to flip Jefferson County, the state's most populous county and home to Birmingham, which had not gone Democratic since 1952 and was won by incumbent Senator Jeff Sessions in the concurrent U.S. Senate election. Marengo County also split tickets for Obama and Sessions.
Campaign
Predictions
There were 16 news organizations who made state-by-state predictions of the election. Here are their last predictions before election day:
| Source | Ranking |
|---|---|
| D.C. Political Report[1] | Likely R |
| Cook Political Report[2] | Solid R |
| The Takeaway[3] | Solid R |
| Electoral-vote.com[4] | Solid R |
| Washington Post[5] | Solid R |
| Politico[6] | Solid R |
| RealClearPolitics[7] | Solid R |
| FiveThirtyEight[5] | Solid R |
| CQ Politics[8] | Solid R |
| The New York Times[9] | Solid R |
| CNN[10] | Safe R |
| NPR[5] | Solid R |
| MSNBC[5] | Solid R |
| Fox News[11] | Likely R |
| Associated Press[12] | Likely R |
| Rasmussen Reports[13] | Safe R |
Polling
Opinion polls taken in Alabama prior to the election consistently showed John McCain to be leading Barack Obama by double digits. RealClearPolitics gave the state an average of 56.8% for McCain, compared to 33.5% for Obama.[14] The state was not seriously contested by either campaign.
Fundraising
John McCain raised a total of $1,846,574 in the state. Barack Obama raised $1,734,629.[15]
Analysis
Alabama is one of the most conservative states in the country and one of the most reliably Republican strongholds in presidential elections. Alabama is located in the lower Bible Belt, where many people are values voters who tend to oppose social issues like abortion, gay rights, and immigration. Like most Southern states, Alabama was a one-party state dominated by conservative Democrats for the better part of a century after Reconstruction. However, it swung dramatically to the Republicans in 1964 in opposition to civil rights legislation. Since then, Democrats have carried the state only once, when Jimmy Carter of neighboring Georgia swept most of the South and East Coast. Although Democrats still nominally have a majority of registered voters, the Democrats have only seriously contested the state two other times since Barry Goldwater carried it in 1964; 1976 (A double-digit victory) and 1980. As in much of the Deep South, Alabama Democrats began splitting their tickets as early as the 1940s when the national party became more receptive toward the Civil Rights Movement, and the rise of the religious right in the 1970s only accelerated this trend.
At the time of the election, Alabama had a Republican Governor (Bob Riley), two Republicans in the U.S. Senate (Richard Shelby and Jeff Sessions), and five of its seven seats in the U.S. House of Representatives were held by Republicans.
On November 4, 2008, Democratic presidential nominee Barack Obama predictably lost by a landslide. However, he performed 2% better in 2008 than John Kerry did in 2004 (both by popular vote and by the number of carried counties). In large part, this can be attributed to high turnout of African American voters in Alabama. Notably, Obama carried Jefferson County, which contains the state's largest city of Birmingham,[18] which last supported the official Democratic candidate for president in 1956. Strangely, many news organizations did not project the state's outcome immediately after the polls closed, possibly due to a wavering African American turnout.
Voting in Alabama, like in other states of the Deep South, was heavily polarized by race. According to exit polls, 98% of black Alabamians voted Democratic while 88% of white Alabamians voted Republican.[19] Obama's 12 percent showing among white Alabamians was easily his worst in the nation, and prevented him from having any realistic chance of carrying the state.[20] Ultimately, McCain won by running up massive landslides in the state's suburban areas; several Birmingham, Montgomery and Mobile suburbs gave McCain over 70 percent of the vote. The old-line Dixiecrats in these areas began splitting their tickets as early as the 1940s; apart from Carter, some of these areas haven't supported a Democrat for president since Adlai Stevenson II in 1956.
Racial polarization was why Obama generally improved on Kerry's performance in Central Alabama, where more African Americans live. Conversely, Obama did much worse than Kerry in North Alabama, where fewer blacks live. Racial polarization was also responsible for Alabama's electoral geography: Obama, like other Democrats, won landslides in the Black Belt while losing badly everywhere else.
With 60.32% of the popular vote, Alabama proved to be McCain's fifth strongest state in the 2008 election after Oklahoma, Wyoming, Utah and Idaho.[21]
Results
| Party | Candidate | Running mate | Votes | Percentage | Electoral votes | |
|---|---|---|---|---|---|---|
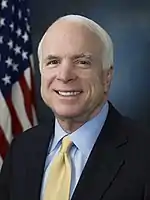
| Republican | John McCain | Sarah Palin | 1,266,546 | 60.32% | 9 | |
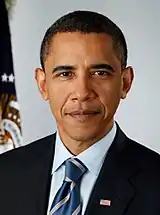
| Democratic | Barack Obama | Joe Biden | 813,479 | 38.74% | 0 | |
| Independent | Ralph Nader | Matt Gonzalez | 6,788 | 0.32% | 0 | |
| Libertarian | Bob Barr | Wayne Allyn Root | 4,991 | 0.24% | 0 | |
| Constitution | Chuck Baldwin | Darrell Castle | 4,310 | 0.20% | 0 | |
| Write-in candidates | 3,705 | 0.18% | 0 | |||
| Totals | 2,099,819 | 100.00% | 9 | |||
| [22] | ||||||
Results breakdown
By county
| County | McCain# | McCain% | Obama# | Obama% | Nader# | Nader% | Barr# | Barr% | Baldwin# | Baldwin% | Others# | Others% | Total |
|---|---|---|---|---|---|---|---|---|---|---|---|---|---|
| Autauga | 17,403 | 73.61% | 6,093 | 25.77% | 46 | 0.19% | 31 | 0.13% | 44 | 0.19% | 24 | 0.10% | 23,641 |
| Baldwin | 61,271 | 75.26% | 19,386 | 23.81% | 250 | 0.31% | 220 | 0.27% | 170 | 0.21% | 116 | 0.14% | 81,413 |
| Barbour | 5,866 | 50.44% | 5,697 | 48.99% | 21 | 0.18% | 11 | 0.09% | 26 | 0.22% | 9 | 0.08% | 11,630 |
| Bibb | 6,262 | 72.44% | 2,299 | 26.60% | 32 | 0.37% | 11 | 0.13% | 26 | 0.30% | 14 | 0.16% | 8,644 |
| Blount | 20,389 | 84.02% | 3,522 | 14.51% | 127 | 0.52% | 81 | 0.33% | 84 | 0.35% | 64 | 0.26% | 24,267 |
| Bullock | 1,391 | 25.69% | 4,011 | 74.07% | 2 | 0.04% | 6 | 0.11% | 2 | 0.04% | 3 | 0.06% | 5,415 |
| Butler | 5,485 | 56.49% | 4,188 | 43.14% | 16 | 0.16% | 7 | 0.07% | 10 | 0.10% | 3 | 0.03% | 9,709 |
| Calhoun | 32,348 | 65.69% | 16,334 | 33.17% | 248 | 0.50% | 137 | 0.28% | 108 | 0.22% | 67 | 0.14% | 49,242 |
| Chambers | 8,067 | 53.94% | 6,799 | 45.46% | 29 | 0.19% | 27 | 0.18% | 19 | 0.13% | 15 | 0.10% | 14,956 |
| Cherokee | 7,928 | 76.41% | 2,306 | 22.23% | 40 | 0.39% | 44 | 0.42% | 39 | 0.38% | 18 | 0.17% | 10,375 |
| Chilton | 13,960 | 78.49% | 3,674 | 20.66% | 51 | 0.29% | 30 | 0.17% | 48 | 0.27% | 22 | 0.12% | 17,785 |
| Choctaw | 4,223 | 53.50% | 3,636 | 46.06% | 15 | 0.19% | 5 | 0.06% | 7 | 0.09% | 8 | 0.10% | 7,894 |
| Clarke | 7,466 | 55.57% | 5,914 | 44.02% | 22 | 0.16% | 16 | 0.12% | 12 | 0.09% | 5 | 0.04% | 13,435 |
| Clay | 4,984 | 73.09% | 1,760 | 25.81% | 31 | 0.45% | 16 | 0.23% | 12 | 0.18% | 16 | 0.23% | 6,819 |
| Cleburne | 5,216 | 80.35% | 1,168 | 17.99% | 24 | 0.37% | 49 | 0.75% | 25 | 0.39% | 10 | 0.15% | 6,492 |
| Coffee | 14,919 | 74.12% | 5,079 | 25.23% | 50 | 0.25% | 36 | 0.18% | 28 | 0.14% | 16 | 0.08% | 20,128 |
| Colbert | 14,739 | 59.33% | 9,703 | 39.06% | 161 | 0.65% | 73 | 0.29% | 63 | 0.25% | 104 | 0.42% | 24,843 |
| Conecuh | 3,470 | 49.98% | 3,429 | 49.39% | 25 | 0.36% | 5 | 0.07% | 12 | 0.17% | 2 | 0.03% | 6,943 |
| Coosa | 3,248 | 58.39% | 2,273 | 40.86% | 14 | 0.25% | 9 | 0.16% | 17 | 0.31% | 2 | 0.04% | 5,563 |
| Covington | 12,444 | 78.82% | 3,240 | 20.52% | 34 | 0.22% | 29 | 0.18% | 26 | 0.16% | 14 | 0.09% | 15,787 |
| Crenshaw | 4,319 | 68.65% | 1,938 | 30.81% | 11 | 0.17% | 5 | 0.08% | 12 | 0.19% | 6 | 0.10% | 6,291 |
| Cullman | 28,896 | 81.85% | 5,864 | 16.61% | 227 | 0.64% | 89 | 0.25% | 150 | 0.42% | 79 | 0.22% | 35,305 |
| Dale | 13,886 | 71.87% | 5,270 | 27.28% | 60 | 0.31% | 35 | 0.18% | 54 | 0.28% | 15 | 0.08% | 19,320 |
| Dallas | 6,798 | 32.60% | 13,986 | 67.07% | 23 | 0.11% | 20 | 0.10% | 14 | 0.07% | 11 | 0.05% | 20,852 |
| DeKalb | 17,957 | 74.77% | 5,658 | 23.56% | 151 | 0.63% | 65 | 0.27% | 64 | 0.27% | 120 | 0.50% | 24,015 |
| Elmore | 25,777 | 75.12% | 8,301 | 24.19% | 70 | 0.20% | 63 | 0.18% | 59 | 0.17% | 45 | 0.13% | 34,315 |
| Escambia | 9,375 | 63.89% | 5,188 | 35.36% | 29 | 0.20% | 28 | 0.19% | 34 | 0.23% | 20 | 0.14% | 14,674 |
| Etowah | 30,595 | 68.39% | 13,497 | 30.17% | 264 | 0.59% | 149 | 0.33% | 124 | 0.28% | 108 | 0.24% | 44,737 |
| Fayette | 5,883 | 73.93% | 1,994 | 25.06% | 50 | 0.63% | 14 | 0.18% | 16 | 0.20% | 0 | 0.00% | 7,957 |
| Franklin | 8,048 | 68.83% | 3,469 | 29.67% | 84 | 0.72% | 25 | 0.21% | 44 | 0.38% | 23 | 0.20% | 11,693 |
| Geneva | 9,417 | 80.78% | 2,134 | 18.31% | 35 | 0.30% | 34 | 0.29% | 32 | 0.27% | 5 | 0.04% | 11,657 |
| Greene | 876 | 16.51% | 4,408 | 83.09% | 4 | 0.08% | 2 | 0.04% | 10 | 0.19% | 5 | 0.09% | 5,305 |
| Hale | 3,200 | 38.96% | 4,982 | 60.65% | 10 | 0.12% | 7 | 0.09% | 8 | 0.10% | 7 | 0.09% | 8,214 |
| Henry | 5,585 | 64.58% | 3,018 | 34.90% | 14 | 0.16% | 8 | 0.09% | 17 | 0.20% | 6 | 0.07% | 8,648 |
| Houston | 29,254 | 70.09% | 12,225 | 29.29% | 78 | 0.19% | 59 | 0.14% | 76 | 0.18% | 43 | 0.10% | 41,735 |
| Jackson | 14,083 | 67.47% | 6,374 | 30.54% | 180 | 0.86% | 59 | 0.28% | 100 | 0.48% | 78 | 0.37% | 20,874 |
| Jefferson | 149,921 | 47.05% | 166,211 | 52.17% | 713 | 0.22% | 793 | 0.25% | 424 | 0.13% | 552 | 0.17% | 318,614 |
| Lamar | 5,419 | 76.59% | 1,614 | 22.81% | 23 | 0.33% | 5 | 0.07% | 14 | 0.20% | 0 | 0.00% | 7,075 |
| Lauderdale | 24,068 | 63.16% | 13,329 | 34.98% | 320 | 0.84% | 128 | 0.34% | 145 | 0.38% | 114 | 0.30% | 38,104 |
| Lawrence | 9,277 | 63.19% | 5,164 | 35.18% | 92 | 0.63% | 40 | 0.27% | 58 | 0.40% | 49 | 0.33% | 14,680 |
| Lee | 32,230 | 59.33% | 21,498 | 39.57% | 192 | 0.35% | 186 | 0.34% | 95 | 0.17% | 124 | 0.23% | 54,325 |
| Limestone | 23,598 | 70.33% | 9,536 | 28.42% | 128 | 0.38% | 103 | 0.31% | 118 | 0.35% | 68 | 0.20% | 33,551 |
| Lowndes | 1,809 | 24.86% | 5,449 | 74.87% | 5 | 0.07% | 3 | 0.04% | 10 | 0.14% | 2 | 0.03% | 7,278 |
| Macon | 1,396 | 12.83% | 9,450 | 86.88% | 8 | 0.07% | 4 | 0.04% | 12 | 0.11% | 7 | 0.06% | 10,877 |
| Madison | 86,965 | 56.88% | 64,117 | 41.93% | 481 | 0.31% | 579 | 0.38% | 392 | 0.26% | 365 | 0.24% | 152,899 |
| Marengo | 5,516 | 48.09% | 5,926 | 51.66% | 16 | 0.14% | 3 | 0.03% | 9 | 0.08% | 1 | 0.01% | 11,471 |
| Marion | 9,536 | 77.18% | 2,600 | 21.04% | 117 | 0.95% | 36 | 0.29% | 34 | 0.28% | 32 | 0.26% | 12,355 |
| Marshall | 25,727 | 77.57% | 7,038 | 21.22% | 175 | 0.53% | 82 | 0.25% | 68 | 0.21% | 76 | 0.23% | 33,166 |
| Mobile | 98,049 | 54.04% | 82,181 | 45.30% | 426 | 0.23% | 327 | 0.18% | 238 | 0.13% | 203 | 0.11% | 181,424 |
| Monroe | 6,175 | 54.88% | 5,025 | 44.66% | 19 | 0.17% | 6 | 0.05% | 15 | 0.13% | 12 | 0.11% | 11,252 |
| Montgomery | 42,031 | 40.13% | 62,166 | 59.35% | 167 | 0.16% | 148 | 0.14% | 107 | 0.10% | 124 | 0.12% | 104,743 |
| Morgan | 36,014 | 71.26% | 13,895 | 27.49% | 223 | 0.44% | 142 | 0.28% | 129 | 0.26% | 139 | 0.28% | 50,542 |
| Perry | 1,679 | 27.26% | 4,457 | 72.37% | 6 | 0.10% | 7 | 0.11% | 7 | 0.11% | 3 | 0.05% | 6,159 |
| Pickens | 5,434 | 53.98% | 4,594 | 45.63% | 19 | 0.19% | 3 | 0.03% | 8 | 0.08% | 9 | 0.09% | 10,067 |
| Pike | 8,004 | 57.36% | 5,879 | 42.13% | 32 | 0.23% | 16 | 0.11% | 13 | 0.09% | 11 | 0.08% | 13,955 |
| Randolph | 7,175 | 69.10% | 3,064 | 29.51% | 42 | 0.40% | 50 | 0.48% | 38 | 0.37% | 15 | 0.14% | 10,384 |
| Russell | 8,705 | 46.02% | 10,085 | 53.32% | 41 | 0.22% | 36 | 0.19% | 28 | 0.15% | 20 | 0.11% | 18,915 |
| Shelby | 69,060 | 76.19% | 20,625 | 22.75% | 228 | 0.25% | 304 | 0.34% | 242 | 0.27% | 184 | 0.20% | 90,643 |
| St. Clair | 27,649 | 81.11% | 6,091 | 17.87% | 118 | 0.35% | 65 | 0.19% | 114 | 0.33% | 51 | 0.15% | 34,088 |
| Sumter | 1,731 | 24.66% | 5,264 | 74.99% | 12 | 0.17% | 5 | 0.07% | 6 | 0.09% | 2 | 0.03% | 7,020 |
| Talladega | 20,112 | 58.80% | 13,779 | 40.28% | 99 | 0.29% | 74 | 0.22% | 92 | 0.27% | 48 | 0.14% | 34,204 |
| Tallapoosa | 13,116 | 67.92% | 6,063 | 31.40% | 47 | 0.24% | 31 | 0.16% | 32 | 0.17% | 22 | 0.11% | 19,311 |
| Tuscaloosa | 45,405 | 57.54% | 32,796 | 41.56% | 211 | 0.27% | 186 | 0.24% | 122 | 0.15% | 192 | 0.24% | 78,912 |
| Walker | 20,722 | 72.32% | 7,420 | 25.90% | 197 | 0.69% | 68 | 0.24% | 105 | 0.37% | 140 | 0.49% | 28,652 |
| Washington | 5,654 | 64.43% | 3,067 | 34.95% | 22 | 0.25% | 5 | 0.06% | 16 | 0.18% | 11 | 0.13% | 8,775 |
| Wilcox | 1,868 | 28.77% | 4,612 | 71.02% | 7 | 0.11% | 1 | 0.02% | 2 | 0.03% | 4 | 0.06% | 6,494 |
| Winston | 8,103 | 80.78% | 1,757 | 17.52% | 74 | 0.74% | 50 | 0.50% | 25 | 0.25% | 22 | 0.22% | 10,031 |
By congressional district
Republican John McCain carried six of the state's seven congressional districts, including two districts (AL-02 and AL-05) that were carried by Democrats (Bobby Bright and Parker Griffith, respectively) in the U.S. House of Representatives
| District | McCain | Obama | Representative | |
|---|---|---|---|---|
| 1st |  |
61.01% | 38.38% | Jo Bonner |
| 2nd |  |
63.42% | 36.05% | Terry Everett (110th Congress) |
| Bobby Bright (111th Congress) | ||||
| 3rd |  |
56.21% | 43.04% | Mike D. Rogers |
| 4th |  |
76.32% | 22.48% | Robert Aderholt |
| 5th |  |
60.91% | 37.99% | Bud Cramer (110th Congress) |
| Parker Griffith (111th Congress) | ||||
| 6th |  |
75.91% | 23.28% | Spencer Bachus |
| 7th |  |
27.28% | 72.36% | Artur Davis |
| [23] | ||||
Electors
Technically the voters of Alabama cast their ballots for electors: representatives to the Electoral College. Alabama is allocated 9 electors because it has 7 congressional districts and 2 senators. All candidates who appear on the ballot or qualify to receive write-in votes must submit a list of 9 electors, who pledge to vote for their candidate and his or her running mate. Whoever wins the majority of votes in the state is awarded all 9 electoral votes. Their chosen electors then vote for president and vice president. Although electors are pledged to their candidate and running mate, they are not obligated to vote for them.[24] An elector who votes for someone other than his or her candidate is known as a faithless elector.
The electors of each state and the District of Columbia met on December 15, 2008, to cast their votes for president and vice president. The Electoral College itself never meets as one body. Instead the electors from each state and the District of Columbia met in their respective capitols.
The following were the members of the Electoral College from the state. All 9 were pledged to John McCain and Sarah Palin.[25]
- Les Barnett
- Will Sellers
- Al Blythe
- Jack Stiefel
- Elbert Peters
- Matthew Fridy
- Bob Cusanelli
- Cam Ward
- Jim Wilson
References
- "D.C.'s Political Report: The complete source for campaign summaries". 2009-01-01. Archived from the original on 2009-01-01. Retrieved 2021-08-23.
- "Presidential". 2015-05-05. Archived from the original on 2015-05-05. Retrieved 2021-08-23.
- "Vote 2008 - The Takeaway - Track the Electoral College vote predictions". 2009-04-22. Archived from the original on 2009-04-22. Retrieved 2021-08-23.
- "Electoral-vote.com: President, Senate, House Updated Daily". electoral-vote.com. Retrieved 2021-08-23.
- Based on Takeaway
- "POLITICO's 2008 Swing State Map - POLITICO.com". www.politico.com. Retrieved 2016-09-22.
- "RealClearPolitics - Electoral Map". Archived from the original on 2008-06-05.
- "CQ Presidential Election Maps, 2008". CQ Politics. Archived from the original on June 14, 2009. Retrieved December 20, 2009.
- Nagourney, Adam; Zeleny, Jeff; Carter, Shan (2008-11-04). "The Electoral Map: Key States". The New York Times. Retrieved May 26, 2010.
- "October – 2008 – CNN Political Ticker - CNN.com Blogs". CNN. 2008-10-31. Retrieved May 26, 2010.
- "Winning The Electoral College". Fox News. April 27, 2010.
- "roadto270". hosted.ap.org. Retrieved 2016-09-22.
- "Election 2008: Electoral College Update - Rasmussen Reports™". www.rasmussenreports.com. Retrieved 2016-09-22.
- "Alabama: McCain vs. Obama". RealClearPolitics. Retrieved May 31, 2009.
- "Presidential Campaign Finance: AL Contributions to All Candidates by 3 digit Zip Code". Federal Election Commission. Archived from the original on March 24, 2009. Retrieved May 30, 2009.
- "Map: Campaign Ad Spending - Election Center 2008 from CNN.com". CNN. Retrieved May 26, 2010.
- "Map: Campaign Candidate Visits - Election Center 2008 from CNN.com". CNN. Retrieved May 26, 2010.
- "AL US President Race". Our Campaigns. Retrieved May 27, 2009.
- "Alabama-Election Results 2008". New York Times. Retrieved 2009-06-10.
- Todd, Chuck and Gawiser, Sheldon. How Barack Obama Won. New York City: Vintage, 2009.
- "2008 Presidential Election Statistics". Dave Leip’s Atlas of U.S. Presidential Elections. Retrieved 2018-03-05.
- "Certified General Election Results without write-in appendix" (PDF). Secretary of State of Alabama. 2008-11-25. Archived from the original (PDF) on 2008-11-27. Retrieved 2008-12-05.
- "Presidential Results by Congressional District, 2000-2008". Swing State Project. December 15, 2008. Retrieved May 31, 2009.
- "Electoral College". California Secretary of State. Archived from the original on October 30, 2008. Retrieved 2008-11-01.
- "Archived copy" (PDF). Archived from the original (PDF) on November 19, 2008. Retrieved November 7, 2008.
{{cite web}}: CS1 maint: archived copy as title (link)