San Luis, Batangas
San Luis, officially the Municipality of San Luis (Tagalog: Bayan ng San Luis), is a 4th class municipality in the province of Batangas, Philippines. According to the 2020 census, it has a population of 36,172 people. [3]
San Luis
Balibago | |
|---|---|
| Municipality of San Luis | |
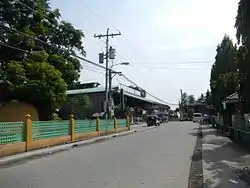 Central school in San Luis | |
 Seal | |
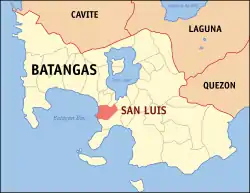 Map of Batangas with San Luis highlighted | |
OpenStreetMap 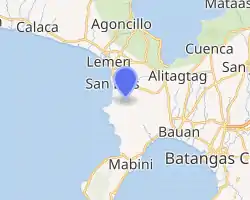 | |
.svg.png.webp) San Luis Location within the Philippines | |
| Coordinates: 13°50′N 120°56′E | |
| Country | Philippines |
| Region | Calabarzon |
| Province | Batangas |
| District | 2nd district |
| Founded | August 25, 1861 |
| Annexation to Taal | 1904 |
| Re-establishment | February 2, 1918 |
| Named for | Louis IX of France |
| Barangays | 26 (see Barangays) |
| Government | |
| • Type | Sangguniang Bayan |
| • Mayor | Danilo D. Medina |
| • Vice Mayor | Oscarlito M. Hernandez |
| • Representative | Raneo E. Abu |
| • Municipal Council | Members |
| • Electorate | 24,366 voters (2019) |
| Area | |
| • Total | 42.56 km2 (16.43 sq mi) |
| Elevation | 54 m (177 ft) |
| Highest elevation | 339 m (1,112 ft) |
| Lowest elevation | 0 m (0 ft) |
| Population | |
| • Total | 36,172 |
| • Density | 850/km2 (2,200/sq mi) |
| • Households | 7,218 |
| Economy | |
| • Income class | 4th municipal income class |
| • Poverty incidence | 15.67% (2018)[4] |
| • Revenue | ₱117,360,006.77 (2020) |
| • Assets | ₱264,298,162.47 (2020) |
| • Expenditure | ₱107,052,933.14 (2020) |
| • Liabilities | ₱58,081,110.09 (2020) |
| Service provider | |
| • Electricity | Batangas 1 Electric Cooperative (BATELEC 1) |
| Time zone | UTC+8 (PST) |
| ZIP code | 4210 |
| PSGC | |
| IDD : area code | +63 (0)43 |
| Native languages | Tagalog |
History
San Luis was historically part of Taal. It was established as an independent town on August 25, 1861. However, in 1904, due to small income, the town was made a part of Taal once again, with all the barrios in existence retaining their names, while the town center (poblacion) was reverted to its Spanish-era name Balibago. On February 2, 1918, San Luis was re-established.[5]
No reliable information could be gathered as to why the town is called San Luis. However, some people believe that it was named as such because it was established during the feast of Saint Louis.[6][7]
Geography
According to the Philippine Statistics Authority, the municipality has a land area of 42.56 square kilometers (16.43 sq mi) [8], constituting 1.36% of the 3,119.75-square-kilometer- (1,204.54 sq mi) total area of Batangas.
Barangays
San Luis is politically subdivided into 26 barangays.[9]
| PSGC | Barangay | Population | ±% p.a. | |||
|---|---|---|---|---|---|---|
| 2020 [3] | 2010 [10] | |||||
| 041024001 | Abiacao | 3.2% | 1,146 | 1,052 | 0.86% | |
| 041024002 | Bagong Tubig | 5.0% | 1,818 | 1,778 | 0.22% | |
| 041024003 | Balagtasin | 1.6% | 561 | 534 | 0.50% | |
| 041024004 | Balite | 2.8% | 997 | 942 | 0.57% | |
| 041024005 | Banoyo | 6.3% | 2,294 | 2,066 | 1.05% | |
| 041024006 | Boboy | 4.2% | 1,502 | 1,480 | 0.15% | |
| 041024007 | Bonliw | 3.2% | 1,145 | 1,002 | 1.35% | |
| 041024008 | Calumpang West | 3.3% | 1,186 | 1,081 | 0.93% | |
| 041024009 | Calumpang East | 4.0% | 1,464 | 1,430 | 0.24% | |
| 041024010 | Dulangan | 7.9% | 2,868 | 2,818 | 0.18% | |
| 041024011 | Durungao | 1.8% | 665 | 621 | 0.69% | |
| 041024012 | Locloc | 1.3% | 458 | 534 | −1.53% | |
| 041024013 | Luya | 3.4% | 1,229 | 1,063 | 1.46% | |
| 041024014 | Mahabang Parang | 2.0% | 734 | 602 | 2.01% | |
| 041024015 | Manggahan | 2.7% | 986 | 924 | 0.65% | |
| 041024016 | Muzon | 5.8% | 2,097 | 2,015 | 0.40% | |
| 041024019 | San Antonio | 1.8% | 656 | 624 | 0.50% | |
| 041024020 | San Isidro | 5.2% | 1,898 | 1,671 | 1.28% | |
| 041024021 | San Jose | 1.9% | 698 | 594 | 1.63% | |
| 041024022 | San Martin | 1.7% | 613 | 542 | 1.24% | |
| 041024023 | Santa Monica | 3.3% | 1,193 | 1,042 | 1.36% | |
| 041024024 | Taliba | 4.6% | 1,657 | 1,484 | 1.11% | |
| 041024025 | Talon | 3.4% | 1,238 | 1,124 | 0.97% | |
| 041024026 | Tejero | 3.5% | 1,258 | 1,068 | 1.65% | |
| 041024027 | Tungal | 1.5% | 558 | 487 | 1.37% | |
| 041024028 | Poblacion | 6.2% | 2,230 | 2,123 | 0.49% | |
| Total | 36,172 | 30,701 | 1.66% | |||
Climate
| Climate data for San Luis, Batangas | |||||||||||||
|---|---|---|---|---|---|---|---|---|---|---|---|---|---|
| Month | Jan | Feb | Mar | Apr | May | Jun | Jul | Aug | Sep | Oct | Nov | Dec | Year |
| Average high °C (°F) | 29 (84) |
30 (86) |
31 (88) |
33 (91) |
32 (90) |
30 (86) |
29 (84) |
29 (84) |
29 (84) |
29 (84) |
29 (84) |
29 (84) |
30 (86) |
| Average low °C (°F) | 20 (68) |
20 (68) |
21 (70) |
22 (72) |
24 (75) |
24 (75) |
24 (75) |
24 (75) |
24 (75) |
23 (73) |
22 (72) |
21 (70) |
22 (72) |
| Average precipitation mm (inches) | 11 (0.4) |
13 (0.5) |
14 (0.6) |
32 (1.3) |
101 (4.0) |
142 (5.6) |
208 (8.2) |
187 (7.4) |
175 (6.9) |
131 (5.2) |
68 (2.7) |
39 (1.5) |
1,121 (44.3) |
| Average rainy days | 5.2 | 5.0 | 7.4 | 11.5 | 19.8 | 23.5 | 27.0 | 25.9 | 25.2 | 23.2 | 15.5 | 8.3 | 197.5 |
| Source: Meteoblue [11] | |||||||||||||
Demographics
| Year | Pop. | ±% p.a. |
|---|---|---|
| 1903 | 5,316 | — |
| 1918 | 6,728 | +1.58% |
| 1939 | 8,464 | +1.10% |
| 1948 | 9,330 | +1.09% |
| 1960 | 12,290 | +2.32% |
| 1970 | 15,133 | +2.10% |
| 1975 | 16,884 | +2.22% |
| 1980 | 17,991 | +1.28% |
| 1990 | 22,143 | +2.10% |
| 1995 | 26,423 | +3.37% |
| 2000 | 26,924 | +0.40% |
| 2007 | 29,645 | +1.34% |
| 2010 | 30,701 | +1.28% |
| 2015 | 33,149 | +1.47% |
| 2020 | 36,172 | +1.73% |
| Source: Philippine Statistics Authority [12] [10] [13][14] | ||
In the 2020 census, San Luis had a population of 36,172. [3] The population density was 850 inhabitants per square kilometre (2,200/sq mi).
Economy
| Poverty Incidence of San Luis | |
| Source: Philippine Statistics Authority[15][16][17][18][19][20][21] | |
Gallery
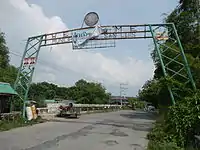 Welcome sign
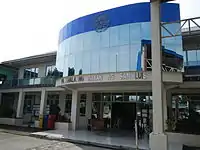 Municipal hall
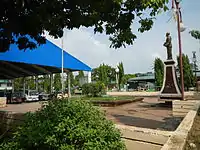 Town plaza
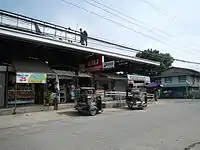 Public market
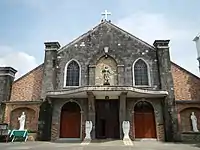 San Isidro Labrador Parish Church
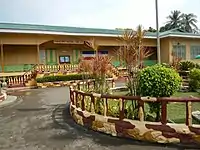 San Luis Central School
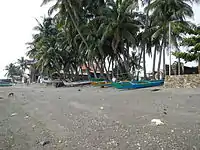 Beach
Beach
References
- Municipality of San Luis | (DILG)
- "2015 Census of Population, Report No. 3 – Population, Land Area, and Population Density" (PDF). Philippine Statistics Authority. Quezon City, Philippines. August 2016. ISSN 0117-1453. Archived (PDF) from the original on May 25, 2021. Retrieved July 16, 2021.
- Census of Population (2020). "Region IV-A (Calabarzon)". Total Population by Province, City, Municipality and Barangay. PSA. Retrieved 8 July 2021.
- "PSA Releases the 2018 Municipal and City Level Poverty Estimates". Philippine Statistics Authority. 15 December 2021. Retrieved 22 January 2022.
- "HISTORY". San Luis Batangas. Retrieved August 9, 2021.
- "San Luis, Batangas: Historical Data". Batangas History. January 4, 2018. Retrieved March 1, 2022.
- Transcribed from “History and Cultural Life of the Town of San Luis, Batangas,” 1953, online at the National Library of the Philippines Digital Collections.
- "Province: Batangas". PSGC Interactive. Quezon City, Philippines: Philippine Statistics Authority. Retrieved 12 November 2016.
- "Municipal: San Luis, Batangas". PSGC Interactive. Quezon City, Philippines: Philippine Statistics Authority. Retrieved 8 January 2016.
- Census of Population and Housing (2010). "Region IV-A (Calabarzon)". Total Population by Province, City, Municipality and Barangay. NSO. Retrieved 29 June 2016.
- "San Luis: Average Temperatures and Rainfall". Meteoblue. Retrieved 5 May 2020.
- Census of Population (2015). "Region IV-A (Calabarzon)". Total Population by Province, City, Municipality and Barangay. PSA. Retrieved 20 June 2016.
- Censuses of Population (1903–2007). "Region IV-A (Calabarzon)". Table 1. Population Enumerated in Various Censuses by Province/Highly Urbanized City: 1903 to 2007. NSO.
- "Province of Batangas". Municipality Population Data. Local Water Utilities Administration Research Division. Retrieved 17 December 2016.
- "Poverty incidence (PI):". Philippine Statistics Authority. Retrieved 28 December 2020.
- https://psa.gov.ph/sites/default/files/NSCB_LocalPovertyPhilippines_0.pdf; publication date: 29 November 2005; publisher: Philippine Statistics Authority.
- https://psa.gov.ph/sites/default/files/2003%20SAE%20of%20poverty%20%28Full%20Report%29_1.pdf; publication date: 23 March 2009; publisher: Philippine Statistics Authority.
- https://psa.gov.ph/sites/default/files/2006%20and%202009%20City%20and%20Municipal%20Level%20Poverty%20Estimates_0_1.pdf; publication date: 3 August 2012; publisher: Philippine Statistics Authority.
- https://psa.gov.ph/sites/default/files/2012%20Municipal%20and%20City%20Level%20Poverty%20Estima7tes%20Publication%20%281%29.pdf; publication date: 31 May 2016; publisher: Philippine Statistics Authority.
- https://psa.gov.ph/sites/default/files/City%20and%20Municipal-level%20Small%20Area%20Poverty%20Estimates_%202009%2C%202012%20and%202015_0.xlsx; publication date: 10 July 2019; publisher: Philippine Statistics Authority.
- "PSA Releases the 2018 Municipal and City Level Poverty Estimates". Philippine Statistics Authority. 15 December 2021. Retrieved 22 January 2022.
External links
| Wikimedia Commons has media related to San Luis, Batangas. |
Places adjacent to San Luis, Batangas | ||||||||||||||||
|---|---|---|---|---|---|---|---|---|---|---|---|---|---|---|---|---|
| ||||||||||||||||
Batangas City (capital) | |
| Municipalities | |
| Component cities | |