Real, Quezon
Real, officially the Municipality of Real (Tagalog: Bayan ng Real), is a 1st class municipality in the province of Quezon, Philippines. According to the 2020 census, it has a population of 38,678 people. [3]
Real | |
|---|---|
| Municipality of Real | |
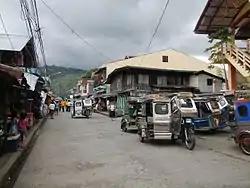 Downtown area | |
 Flag Seal | |
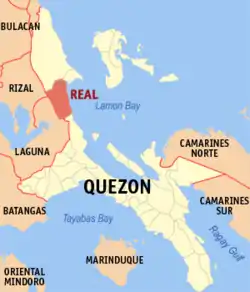 Map of Quezon with Real highlighted | |
OpenStreetMap 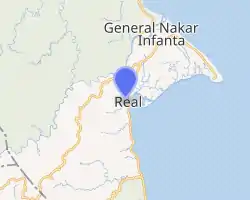 | |
.svg.png.webp) Real Location within the Philippines | |
| Coordinates: 14°40′N 121°36′E | |
| Country | Philippines |
| Region | Calabarzon |
| Province | Quezon |
| District | 1st district |
| Founded | December 15, 1960 |
| Barangays | 17 (see Barangays) |
| Government | |
| • Type | Sangguniang Bayan |
| • Mayor | Diana Abigail D. Aquino |
| • Vice Mayor | Joel Amando A. Diestro |
| • Representative | Wilfrido Mark M. Enverga |
| • Municipal Council | Members |
| • Electorate | 20,700 voters (2019) |
| Area | |
| • Total | 563.89 km2 (217.72 sq mi) |
| Elevation | 137 m (449 ft) |
| Highest elevation | 1,078 m (3,537 ft) |
| Lowest elevation | 0 m (0 ft) |
| Population | |
| • Total | 38,678 |
| • Density | 69/km2 (180/sq mi) |
| • Households | 7,955 |
| Economy | |
| • Income class | 1st municipal income class |
| • Poverty incidence | 8.71% (2018)[4] |
| • Revenue | ₱226,348,014.99 (2020) |
| • Assets | ₱622,458,664.04 (2020) |
| • Expenditure | ₱207,123,193.74 (2020) |
| • Liabilities | ₱150,450,379.46 (2020) |
| Service provider | |
| • Electricity | Quezon 2 Electric Cooperative (QUEZELCO 2) |
| Time zone | UTC+8 (PST) |
| ZIP code | 4335 |
| PSGC | |
| IDD : area code | +63 (0)42 |
| Native languages | Tagalog |
| Website | www |
This coastal town, located on the eastern shores of Luzon facing the Philippine Sea, is noted for its rural beach resorts.
Geography
Real is a small town facing the Pacific Ocean, approximately 133 kilometres (83 mi) from the Quezon capital Lucena City and 145 kilometres (90 mi) from Manila. Real has 17 barangays: 14 rural and 3 urban. Its total land area is 563.8 km2, the second largest in the province.
Tourist spots include zigzag road views, Balagbag Falls, river scenery, and Baluti Island. It also has tourist-frequented beaches known for surfing.[5]
Barangays
Real is politically subdivided into 17 barangays.
- Poblacion I (Barangay 1)
- Capalong
- Cawayan
- Kiloloron
- Llavac
- Lubayat
- Malapad
- Maragondon
- Pandan
- Tanauan
- Tignoan
- Ungos
- Poblacion 61 (Barangay 2)
- Maunlad
- Bagong Silang
- Masikap
- Tagumpay
Climate
| Climate data for Real, Quezon | |||||||||||||
|---|---|---|---|---|---|---|---|---|---|---|---|---|---|
| Month | Jan | Feb | Mar | Apr | May | Jun | Jul | Aug | Sep | Oct | Nov | Dec | Year |
| Average high °C (°F) | 26 (79) |
27 (81) |
28 (82) |
31 (88) |
31 (88) |
30 (86) |
29 (84) |
29 (84) |
29 (84) |
29 (84) |
28 (82) |
27 (81) |
29 (84) |
| Average low °C (°F) | 22 (72) |
22 (72) |
22 (72) |
23 (73) |
25 (77) |
25 (77) |
25 (77) |
25 (77) |
24 (75) |
24 (75) |
23 (73) |
22 (72) |
24 (74) |
| Average precipitation mm (inches) | 40 (1.6) |
33 (1.3) |
35 (1.4) |
38 (1.5) |
138 (5.4) |
190 (7.5) |
242 (9.5) |
216 (8.5) |
224 (8.8) |
200 (7.9) |
114 (4.5) |
94 (3.7) |
1,564 (61.6) |
| Average rainy days | 12.2 | 9.0 | 11.0 | 11.7 | 21.5 | 24.0 | 27.2 | 26.1 | 26.8 | 22.3 | 16.3 | 15.1 | 223.2 |
| Source: Meteoblue [6] | |||||||||||||
History
Spanish forces landed at the site of Real early in the colonization period, calling it Puerto Real. Spanish galleons and ships docked at the port reinforced forces stationed at the nearby place "Binangonan del Ampon" known now as Infanta.
Formerly a barrio of Infanta, Real was created into a municipal district with a set of government comprising the barrios of Llavac, Cawayan, Capalong, Tignoan, Kiloloron, Lubayat and Pandan which were all segregated from the mothertown of Infanta. This was by the virtue of Executive Order No. 410 dated December 15, 1960, by President Carlos P. Garcia.
On November 29, 2004, Real was hit hard by Typhoons Winnie, Violeta, and Yoyong. About 500 people were either killed or missing.
 Typhoon damage in December 2004
 Relief aid delivery in Real, December 2004
Demographics
| Year | Pop. | ±% p.a. |
|---|---|---|
| 1970 | 10,079 | — |
| 1975 | 13,231 | +5.61% |
| 1980 | 14,463 | +1.80% |
| 1990 | 20,475 | +3.54% |
| 1995 | 27,641 | +5.78% |
| 2000 | 30,684 | +2.26% |
| 2007 | 33,073 | +1.04% |
| 2010 | 35,189 | +2.28% |
| 2015 | 35,979 | +0.42% |
| 2020 | 38,678 | +1.43% |
| Source: Philippine Statistics Authority [7] [8] [9][10] | ||
Economy
| Poverty Incidence of Real | |
| Source: Philippine Statistics Authority[11][12][13][14][15][16][17] | |
References
- Municipality of Real | (DILG)
- "2015 Census of Population, Report No. 3 – Population, Land Area, and Population Density" (PDF). Philippine Statistics Authority. Quezon City, Philippines. August 2016. ISSN 0117-1453. Archived (PDF) from the original on May 25, 2021. Retrieved July 16, 2021.
- Census of Population (2020). "Region IV-A (Calabarzon)". Total Population by Province, City, Municipality and Barangay. PSA. Retrieved 8 July 2021.
- "PSA Releases the 2018 Municipal and City Level Poverty Estimates". Philippine Statistics Authority. 15 December 2021. Retrieved 22 January 2022.
- Ventura, Anika. "Classes. More Fun in the Philippines". It's More Fun in the Philippines. Philippine Department of Tourism. Retrieved 26 November 2015.
- "Real: Average Temperatures and Rainfall". Meteoblue. Retrieved 27 January 2020.
- Census of Population (2015). "Region IV-A (Calabarzon)". Total Population by Province, City, Municipality and Barangay. PSA. Retrieved 20 June 2016.
- Census of Population and Housing (2010). "Region IV-A (Calabarzon)". Total Population by Province, City, Municipality and Barangay. NSO. Retrieved 29 June 2016.
- Censuses of Population (1903–2007). "Region IV-A (Calabarzon)". Table 1. Population Enumerated in Various Censuses by Province/Highly Urbanized City: 1903 to 2007. NSO.
- "Province of Quezon". Municipality Population Data. Local Water Utilities Administration Research Division. Retrieved 17 December 2016.
- "Poverty incidence (PI):". Philippine Statistics Authority. Retrieved 28 December 2020.
- https://psa.gov.ph/sites/default/files/NSCB_LocalPovertyPhilippines_0.pdf; publication date: 29 November 2005; publisher: Philippine Statistics Authority.
- https://psa.gov.ph/sites/default/files/2003%20SAE%20of%20poverty%20%28Full%20Report%29_1.pdf; publication date: 23 March 2009; publisher: Philippine Statistics Authority.
- https://psa.gov.ph/sites/default/files/2006%20and%202009%20City%20and%20Municipal%20Level%20Poverty%20Estimates_0_1.pdf; publication date: 3 August 2012; publisher: Philippine Statistics Authority.
- https://psa.gov.ph/sites/default/files/2012%20Municipal%20and%20City%20Level%20Poverty%20Estima7tes%20Publication%20%281%29.pdf; publication date: 31 May 2016; publisher: Philippine Statistics Authority.
- https://psa.gov.ph/sites/default/files/City%20and%20Municipal-level%20Small%20Area%20Poverty%20Estimates_%202009%2C%202012%20and%202015_0.xlsx; publication date: 10 July 2019; publisher: Philippine Statistics Authority.
- "PSA Releases the 2018 Municipal and City Level Poverty Estimates". Philippine Statistics Authority. 15 December 2021. Retrieved 22 January 2022.
External links
| Wikimedia Commons has media related to Real, Quezon. |
- Real Profile at PhilAtlas.com
- Philippine Standard Geographic Code
- Philippine Census Information
- Local Governance Performance Management System
Places adjacent to Real, Quezon | |
|---|---|
Lucena (capital) | |
| Municipalities |
|
| Component city | |
| Highly urbanized city |
|