Demographics of Indonesia
The population of Indonesia was 270.20 million according to the 2020 national census, an increase from 237.64 in 2010.[1][2] Approximately 55% of Indonesia's population resides on Java, which is the most populous island in the world.Based on current projections, Indonesia’s current population is expected to reach its peak of 337.38 million by 2067 and the decrease in the decades following.[3]


Despite a fairly effective family planning program that has been in place since 1967,[4] Indonesia's average population growth per year was over 1.1% for the decade ending in 2020, nearly having 13% population growth for that decade. At this rate, Indonesia's population is projected to surpass the population of the United States if the population growth is not maintained .[5]
Indonesia has a relatively young population compared to Western nations, though it is aging as the country's birth rate has slowed and its life expectancy has increased. The median age was 30.2 years in 2017.[6] Indonesia includes numerous ethnic, cultural and linguistic groups, some of which are related to each other. Since independence, Indonesian (a form of Malay and the official national language) is the language of most written communication, education, government, and business. Many local ethnic languages are the first language of most Indonesians and are still important.
Population

| Year | Pop. | ±% p.a. |
|---|---|---|
| 0 | 2,000,000 | — |
| 1000 | 3,500,000 | +0.06% |
| 1500 | 7,750,000 | +0.16% |
| 1700 | 9,500,000 | +0.10% |
| 1930 | 60,727,233 | +0.81% |
| 1955 | 77,473,268 | +0.98% |
| 1961 | 97,085,348 | +3.83% |
| 1971 | 119,208,229 | +2.07% |
| 1976 | 141,862,419 | +3.54% |
| 1980 | 147,490,298 | +0.98% |
| 1990 | 179,378,946 | +1.98% |
| 2000 | 206,264,595 | +1.41% |
| 2010 | 237,641,326 | +1.43% |
| 2020 | 270,203,917 | +1.29% |
| Source: Our World in Data,[7] Statistics Indonesia,[8][9] Wertheim (1959),[10] Geografi dan Kependudukan (1976),[11] Widjojo Nitisastro (2006)[12] | ||
Population by province
| Province | Population (2010 Census) |
Urban % in 2010 |
Total Fertility Rate |
Population (2015 Census) |
|---|---|---|---|---|
| Aceh | 4,494,410 | 23.6 | 2.79 | 4,486,570 |
| North Sumatra | 12,982,204 | 42.4 | 3.01 | 13,923,262 |
| West Sumatra | 4,846,909 | 29.0 | 2.91 | 5,190,577 |
| Riau | 5,538,367 | 43.7 | 2.82 | 6,330,941 |
| Jambi | 3,092,265 | 28.3 | 2.51 | 3,397,164 |
| South Sumatra | 7,450,394 | 34.4 | 2.56 | 8,043,042 |
| Bengkulu | 1,715,518 | 29.4 | 2.51 | 1,872,136 |
| Lampung | 7,608,405 | 21.0 | 2.45 | 8,109,601 |
| Bangka Belitung Islands | 1,223,296 | 43.0 | 2.54 | 1,370,331 |
| Riau Islands | 1,679,163 | 67.4 | 2.38 | 1,968,313 |
| Banten | 10,632,166 | 52.2 | 2.35 | 11,934,373 |
| Jakarta | 9,607,787 | 100.0 | 1.82 | 10,154,134 |
| West Java | 43,053,732 | 50.3 | 2.43 | 46,668,214 |
| Central Java | 32,382,657 | 40.4 | 2.20 | 33,753,023 |
| Yogyakarta | 3,457,491 | 57.7 | 1.94 | 3,675,768 |
| East Java | 37,476,757 | 40.9 | 2.00 | 38,828,061 |
| Bali | 3,890,757 | 49.8 | 2.13 | 4,148,588 |
| West Nusa Tenggara | 4,500,212 | 34.8 | 2.59 | 4,830,118 |
| East Nusa Tenggara | 4,683,827 | 15.9 | 3.82 | 5,112,760 |
| West Kalimantan | 4,395,983 | 25.1 | 2.64 | 4,783,209 |
| Central Kalimantan | 2,212,089 | 27.5 | 2.56 | 2,490,178 |
| South Kalimantan | 3,626,616 | 36.3 | 2.35 | 3,984,315 |
| East Kalimantan | 3,028,487 | 57.6 | 2.61 | 3,422,676 |
| North Kalimantan | 524,656 | 639,639 | ||
| North Sulawesi | 2,270,596 | 37.0 | 2.43 | 2,409,921 |
| Gorontalo | 1,040,164 | 25.5 | 2.76 | 1,131,670 |
| Central Sulawesi | 2,635,009 | 19.7 | 2.94 | 2,872,857 |
| South Sulawesi | 8,034,776 | 29.4 | 2.55 | 8,512,608 |
| Southeast Sulawesi | 2,232,586 | 20.8 | 3.20 | 2,495,248 |
| West Sulawesi | 1,158,651 | -- | 3.33 | 1,279,994 |
| Maluku | 1,533,506 | 25.9 | 3.56 | 1,683,856 |
| North Maluku | 1,038,087 | 29.5 | 3.35 | 1,160,275 |
| Papua | 2,833,381 | 22.2 | 2.87 | 3,143,088 |
| West Papua | 760,422 | -- | 3.18 | 868,819 |
| Indonesia | 237,641,326 | 2.41 | 255,182,144 |
Source: Population Census 2010,[2] except for final column, taken from Inter-Census Survey 2015.
Note: (a) North Kalimantan province was created in 2012 (by separation from East Kalimantan province); the 2010 total figures given are those for the provinces as they were following that splitting (Urban % and Total Fertility Rate columns unadjusted).
Largest cities
| Rank | Name | Province | Pop. | Rank | Name | Province | Pop. | ||
|---|---|---|---|---|---|---|---|---|---|
 Jakarta .jpg.webp) Surabaya |
1 | Jakarta | Jakarta | 10,562,088 | 11 | South Tangerang | Banten | 1,354,350 |  Bekasi  Bandung |
| 2 | Surabaya | East Java | 2,874,314 | 12 | Batam | Riau Islands | 1,196,396 | ||
| 3 | Bekasi | West Java | 2,543,676 | 13 | Bandar Lampung | Lampung | 1,166,066 | ||
| 4 | Bandung | West Java | 2,444,160 | 14 | Bogor | West Java | 1,043,070 | ||
| 5 | Medan | North Sumatra | 2,435,252 | 15 | Pekanbaru | Riau | 983,356 | ||
| 6 | Depok | West Java | 2,056,335 | 16 | Padang | West Sumatra | 909,040 | ||
| 7 | Tangerang | Banten | 1,895,486 | 17 | Malang | East Java | 843,810 | ||
| 8 | Palembang | South Sumatra | 1,668,848 | 18 | Samarinda | East Kalimantan | 827,994 | ||
| 9 | Semarang | Central Java | 1,653,524 | 19 | Denpasar | Bali | 725,314 | ||
| 10 | Makassar | South Sulawesi | 1,423,877 | 20 | Tasikmalaya | West Java | 716,155 | ||
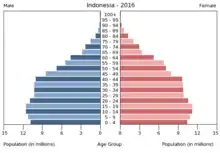
Age structure
Age structure in Indonesia (2020)[13]
Vital statistics

|
3.3 to 3.5
3.0 to 3.2
2.7 to 2.9
2.4 to 2.6
2.1 to 2.3 |
United Nations estimates
| Period | Live births per year | Deaths per year | Natural change per year | CBR1 | CDR1 | NC1 | TFR1 | IMR1 |
|---|---|---|---|---|---|---|---|---|
| 1950–1955 | 3,347,000 | 1,933,000 | 1,414,000 | 42.7 | 21.4 | 21.3 | 5.49 | 191.9 |
| 1955–1960 | 3,897,000 | 1,888,000 | 2,009,000 | 44.8 | 19.2 | 25.6 | 5.67 | 163.8 |
| 1960–1965 | 4,280,000 | 1,820,000 | 2,461,000 | 43.6 | 16.8 | 26.8 | 5.62 | 139.3 |
| 1965–1970 | 4,628,000 | 1,768,000 | 2,860,000 | 41.5 | 14.4 | 27.1 | 5.57 | 117.4 |
| 1970–1975 | 4,842,000 | 1,691,000 | 3,151,000 | 38.2 | 12.2 | 26.0 | 5.30 | 98.9 |
| 1975–1980 | 4,985,000 | 1,630,000 | 3,356,000 | 34.9 | 10.5 | 24.4 | 4.73 | 83.2 |
| 1980–1985 | 5,065,000 | 1,590,000 | 3,475,000 | 31.7 | 9.2 | 22.5 | 4.11 | 69.8 |
| 1985–1990 | 4,853,000 | 1,555,000 | 3,298,000 | 27.5 | 8.3 | 19.2 | 3.40 | 58.5 |
| 1990–1995 | 4,702,000 | 1,547,000 | 3,155,000 | 24.4 | 7.6 | 16.8 | 2.90 | 49.1 |
| 1995–2000 | 4,518,000 | 1,564,000 | 2,954,000 | 21.8 | 7.2 | 14.6 | 2.55 | 41.1 |
| 2000–2005 | 4,638,000 | 1,620,000 | 3,018,000 | 22.0 | 7.4 | 13.7 | 2.52 | 34.5 |
| 2005–2010 | 4,464,000 | 1,692,000 | 2,772,000 | 21.3 | 7.2 | 11.9 | 2.50 | 28.8 |
| 2010–2015 | 20.2 | 7.1 | 13.1 | 2.45 | ||||
| 2015–2020 | 18.4 | 7.2 | 11.2 | 2.32 | ||||
| 2020–2025 | 17.0 | 7.5 | 9.5 | 2.21 | ||||
| 2025–2030 | 15.9 | 7.9 | 8.0 | 2.12 | ||||
| 1 CBR = crude birth rate (per 1000); CDR = crude death rate (per 1000); NC = natural change (per 1000); TFR = total fertility rate (number of children per woman); IMR = infant mortality rate per 1000 births
Source:[14] | ||||||||
Registered births and deaths
Data from Department of Statistics of Indonesia :[15]
| Average population | Live births | Deaths | Natural change | Crude birth rate (per 1,000) | Crude death rate (per 1,000) | Natural change (per 1,000) | Fertility rates | |
|---|---|---|---|---|---|---|---|---|
| 2003 | 213,600,000 | apprx. 4,439,176 | 13.4 | |||||
| 2004 | 216,400,000 | apprx. 4,439,176 | 13.3 | |||||
| 2005 | 219,800,000 | apprx. 4,439,176 | 13.2 | |||||
| 2006 | 222,700,000 | apprx. 4,439,176 | 13.0 | |||||
| 2007 | 225,600,000 | apprx. 4,439,176 | 12.8 | |||||
| 2008 | 228,500,000 | apprx. 4,439,176 | 12.5 | |||||
| 2009 | 231,400,000 | apprx. 4,418,871 | 12.2 | |||||
| 2010 | 237,641,326 | apprx. 4,418,871 | 1,236,154 | 18.6 | 5.2 | |||
| 2011 | 241,000,000 | apprx. 4,418,871 | 13.2 | |||||
| 2012 | 244,200,000 | apprx. 4,418,871 | 13.1 | 2,6 | ||||
| 2015 | 255,587,900 | apprx. 4,418,871 | ||||||
| 2016 | 258,496,500 | apprx. 4,414,499 | ||||||
| 2017 | 261,355,500 | apprx. 4,414,499 | 2.4 | |||||
| 2018 | 264,161,600 | apprx. 4,414,499 | ||||||
| 2019 | 266,911,900 | apprx. 4,414,499 | ||||||
| 2020 | 269,603,400 | apprx. 4,414,499 | ||||||
| 2021 | 271,350,000 | 2.24 |
Fertility and Births (Demographic and Health Surveys)
Total Fertility Rate (TFR) (Wanted Fertility Rate) and Crude Birth Rate (CBR):[16]
| Year | CBR (Total) | TFR (Total) | CBR (Urban) | TFR (Urban) | CBR (Rural) | TFR (Rural) |
|---|---|---|---|---|---|---|
| 1981-1983 | 4.3 | |||||
| 1987 | 3.4 (3.1) | 2.9 (2.6) | 3.7 (3.4) | |||
| 1991 | 25.1 | 3.02 (2.50) | 24.0 | 2.60 (2.03) | 25.6 | 3.24 (2.73) |
| 1994 | 2.9 (2.4) | 2.3 (1.8) | 3.2 (2.7) | |||
| 1997 | 2.8 (2.4) | 2.4 (2.0) | 3.0 (2.6) | |||
| 2002-2003 | 21.9 | 2.6 (2.2) | 22.1 | 2.4 (2.1) | 21.7 | 2.7 (2.3) |
| 2007 | 20.9 | 2.6 (2.2) | 20.2 | 2.3 (2.0) | 21.5 | 2.8 (2.4) |
| 2012 | 20.4 | 2.6 (2.0) | 20.1 | 2.4 (1.9) | 20.7 | 2.8 (2.2) |
| 2017 | 18.1 | 2.4 (2.1) | 17.7 | 2.3 (1.9) | 18.5 | 2.6 (2.2) |
According to the CIA World Factbook , in 2020 Indonesia's average total fertility rate was 2.04 children/born per woman.[17]
Fertility rate and aging population (by province)
Total fertility rate (TFR) and population over age 60 by region as of 2010:[18]
| Province | Total fertility rate (2010) | Population over age 60 (2010) |
|---|---|---|
| North Sumatera | 3.01 | 5.9 |
| West Sumatera | 2.91 | 8.1 |
| Riau | 2.82 | 4.0 |
| Jambi | 2.51 | 5.5 |
| South Sumatera | 2.56 | 6.2 |
| Bengkulu | 2.51 | 5.8 |
| Lampung | 2.45 | 7.2 |
| Bangka Belitung | 2.54 | 5.8 |
| Kepulauan Riau | 2.38 | 3.4 |
| Jakarta | 1.82 | 5.1 |
| West Java | 2.43 | 7.0 |
| Central Java | 2.20 | 10.3 |
| Yogyakarta | 1.94 | 12.9 |
| East Java | 2.00 | 10.4 |
| Banten | 2.35 | 4.6 |
| Bali | 2.13 | 9.7 |
| East Nusa Tenggara | 3.82 | 7.4 |
| West Kalimantan | 2.64 | 5.8 |
| Central Kalimantan | 2.56 | 4.6 |
| South Kalimantan | 2.35 | 5.8 |
| East Kalimantan | 2.61 | 4.0 |
| North Sulawesi | 2.43 | 8.4 |
| Central Sulawesi | 2.94 | 6.6 |
| South Sulawesi | 2.55 | 8.2 |
| Southeast Sulawesi | 3.20 | 5.8 |
| Gorontalo | 2.76 | 5.9 |
| West Sulawesi | 3.33 | 6.2 |
| Maluku | 3.56 | 6.2 |
| North Maluku | 3.35 | 4.8 |
| West Papua | 3.18 | 3.2 |
| Papua | 2.87 | 2.4 |
Life expectancy
| Period | Life expectancy in Years |
Period | Life expectancy in Years |
|---|---|---|---|
| 1950–1955 | 43.5 | 1985–1990 | 62.4 |
| 1955–1960 | 47.0 | 1990–1995 | 64.2 |
| 1960–1965 | 50.2 | 1995–2000 | 65.8 |
| 1965–1970 | 53.1 | 2000–2005 | 66.7 |
| 1970–1975 | 55.9 | 2005–2010 | 68.6 |
| 1975–1980 | 58.5 | 2010–2015 | 69.4 |
| 1980–1985 | 60.7 |
Source: UN World Population Prospects[19]
Ethnic groups
There are over 1,300 ethnic groups in Indonesia;[20] 95% of those are of Native Indonesian ancestry. Javanese is the largest group with 100 million people (42%), followed by Sundanese, who number nearly 40 million (15%).
Religions
Indonesia is the world's most populous Muslim-majority nation; 86.7% of Indonesians declared themselves Muslim in the 2018 census.[23] 10.72% of the population adhered to Christianity (of which more than 70% were Protestant), 1.74% were Hindu, 0.77% Buddhist, and 0.07% of other faiths. Most Indonesian Hindus are Balinese[24] and most Buddhists in modern-day Indonesia are Chinese.[25]
Languages
Indonesian is the official language, but there are many different languages native to Indonesia. According to Ethnologue, there are currently 737 living languages spoken in Indonesia,[26] the most widely spoken being Javanese and Sundanese. In Western New Guinea, there are more than 270 indigenous languages in spoken form.[27][28] Some Chinese varieties, most prominently Min Nan, are also spoken. The public use of Chinese, especially usage of Chinese characters, was dissuaded officially between 1966 and 1998.[29]
Literacy
definition: age 15 and over can read and write
total population: 92.81%
male: 95.5%
female: 90.4% (2011 est.)
Education is free in state schools; it is compulsory for children through to grade 12. Although about 92% of eligible children are enrolled in primary school, a much smaller percentage attends full-time. About 44% of secondary school-age children attend junior high school, and some others of this age group attend vocational schools.
CIA World Factbook demographic statistics
The following demographic statistics are from the CIA World Factbook,[30] unless otherwise indicated.
Age structure
- 0-14 years: 25.02% (male 33,205,805/female 31,994,844)
- 15-24 years: 16.99% (male 22,537,842/female 21,738,210)
- 25-54 years: 42.4% (male 56,493,414/female 53,980,979)
- 55-64 years: 8.58% (male 10,192,430/female 12,177,931)
- 65 years and over: 7.01% (male 7,954,795/female 10,304,489) (2017 est.)
- 0-14 years: 23.33%
- 15-64 years: 70.72%
- 65 years and over: 5,95% (2020 census)[31]
Median age
- total: 30.2 years
- male: 29.6 years
- female: 30.8 years (2017 est.)
Birth rate
- 16.2 births/1,000 population (2017 est.)
Death rate
- 6.5 deaths/1,000 population (2017 est.)
Population growth rate
- 1.097% (2010 est.)
- 1.04% (2012 est.)
- 0.86% (2017 est.)
Urbanization
- urban population: 55.3% of total population (2018)
- rate of urbanisation: 2.27% annual rate of change (2015-20 est.)
Sex ratio
- at birth: 1.04 male(s)/female
- 0-14 years: 1.04 male(s)/female
- 15-24 years: 1.04 male(s)/female
- 25-54 years: 1.04 male(s)/female
- 55-64 years: 0.84 male(s)/female
- 65 years and over: 0.77 male(s)/female
- total population: 1 male(s)/female (2017 est.)
Infant mortality rate
- total: 22.7 deaths/1,000 live births
- male: 26.6 deaths/1,000 live births
- female: 18.6 deaths/1,000 live births (2017 est.)
Life expectancy at birth
- total population: 73 years
- male: 70.4 years
- female: 75.7 years (2017 est.)
HIV/AIDS
- Adult prevalence rate: 0.4% (2017 est.)
- People living with HIV/AIDS: 630,000 (2017 est.)
- HIV/AIDS deaths: 39,000 (2017 est.)
Obesity - adult prevalence rate
- 6.9% (2016)
Children under the age of 5 years underweight
- 19.9% (2013)
Nationality
- noun: Indonesian(s)
- adjective: Indonesian
- Ethnic groups: Javanese 40.1%, Sundanese 15.5%, Malay 3.7%, Batak 3.6%, Madurese 3%, Betawi 2.9%, Minangkabau 2.7%, Buginese 2.7%, Bantenese 2%, Banjarese 1.7%, Balinese 1.7%, Acehnese 1.4%, Dayak 1.4%, Sasak 1.3%, Chinese 1.2%, other 15% (2010 est.)
Religions
- Muslim 86.7%, Christianity 10.72% (Protestant 7.6% and Roman Catholic 3.12%), Hinduism 1.74%, other 0.8% (includes Buddhist and Confucian), unspecified 0.04% (2018 est.)
Languages
- Indonesian (official, a form of Malay influenced by other languages of Indonesia), local languages (the most widely spoken of which is Javanese).
School life expectancy (primary to tertiary education)
- total: 11 years
- male: 12 years
- female: 11 years (2005)
Education expenditures
- 2.8% of GDP (2014)
References
- "Hasil Sensus Penduduk 2020" (PDF) (in Indonesian). Statistics Indonesia. 21 January 2021. p. 9. Retrieved 21 January 2021.
- "Population of Indonesia by Province 1971, 1980, 1990, 1995, 2000 and 2010". Statistics Indonesia. Archived from the original on 23 November 2017. Retrieved 18 May 2015.
- "Indonesia Population 2022 (Demographics, Maps, Graphs)". worldpopulationreview.com. Retrieved 8 April 2022.
- Witton, Patrick (2003). Indonesia. Melbourne: Lonely Planet. p. 47. ISBN 1-74059-154-2.
- Shamim Adam; Berni Moestafa; Novrida Manurung (28 January 2014). "Indonesia Population Approaching U.S. Revives Birth Control". Bloomberg.com. Retrieved 18 May 2015.
- "Indonesia Demographics Profile".
- "Indonesia Population - Our World in Data". www.ourworldindata.org.
- "Hasil Sensus Penduduk 2020" (PDF) (in Indonesian). Statistics Indonesia. 21 January 2021. p. 9. Retrieved 21 January 2021.
- "Population of Indonesia by Province 1971, 1980, 1990, 1995, 2000 and 2010". Central Bureau of Statistics. Archived from the original on 23 November 2017. Retrieved 20 July 2015.
- Wertheim, W. F. (1959). Indonesian Society in Transition (Second (revised) ed.). 's-Gravenhage: Uitgeverij W. van Hoeve. p. 370.
- Geografi dan Kependudukan untuk SMP kelas 2 [Geography and Demographics for High School Grade 2] (in Indonesian). FA. Hasmar. 1976.
- Nitisastro, Widjojo (2006). Population trends in Indonesia. ISBN 9789793780436.
- "Hasil Sensus Penduduk 2020" (PDF) (in Indonesian). Statistics Indonesia. 21 January 2021. p. 9. Retrieved 21 January 2021.
- "World Population Prospects: The 2017 Revision". Archived from the original on 6 May 2011. Retrieved 17 December 2011.
- "Department of Statistics of Indonesia".
- "MEASURE DHS: Demographic and Health Surveys".
- "Indonesia People 2020, CIA World Factbook".
- http://www.ifa-fiv.org/wp-content/2014/09/Indonesian_Ageing_Monograph-print-version1.pdf%5B%5D
- "World Population Prospects – Population Division – United Nations". Archived from the original on 19 September 2016. Retrieved 15 July 2017.
- "Mengulik Data Suku di Indonesia". Badan Pusat Statistik. 18 November 2015. Retrieved 12 February 2020.
- "Statistik Umat Menurut Agama di Indonesia" (in Indonesian). Kementerian Agama Republik Indonesia. 15 May 2018. Archived from the original on 3 September 2020. Retrieved 15 November 2020.
Muslim 231.069.932 (86.7), Christian 20.246.267 (7.6), Catholic 8.325.339 (3.12), Hindu 4.646.357 (1.74), Buddhist 2.062.150 (0.77), Confucianism 117091 (0.03), Other 299617 (0.13), Not Stated 139582 (0.06), Not Asked 757118 (0.32), Total 266.534.836
- "Penduduk Menurut Wilayah dan Agama yang Dianut" [Population by Region and Religion] (in Indonesian). Jakarta, Indonesia: Badan Pusat Statistik. 15 May 2010. Retrieved 20 October 2011.
Religion is belief in Almighty God that must be possessed by every human being. Religion can be divided into Muslim, Christian,, Hindu, Buddhist, Hu Khong Chu, and Other Religion.
Muslim 207176162 (87.20%), Christian 16528513 (7), Catholic 6907873 (3), Hindu 4012116 (1.69), Buddhist 1703254 (0.74), Confucianism 71.999 (0.05), Other 112.792 (0.04), Total 237.641.326 - Penduduk Menurut Wilayah dan Agama yang Dianut
- Oey, Eric (1997). Bali (3rd ed.). Singapore: Periplus Editions. ISBN 962-593-028-0.
- "Indonesia - Buddhism". U.S. Library of Congress. Retrieved 15 October 2006.
- ethnologue.com
- Riesberg, Sonja; Shiohara, Asako; Utsumi, Atsuko (2018). Perspectives on information structure in Austronesian languages. Language Science Press. ISBN 978-3-96110-108-5.
- "5 Reasons Why Companies Should Do Business in Indonesia". NNRoad. 1 April 2020. Retrieved 16 December 2020.
- Tiwary, Shiv Shanker; Kumar, Rajeev (2009). Encyclopaedia of Southeast Asia and Its Tribes. Anmol Publications. ISBN 978-81-261-3837-1.
- Central Intelligence Agency (2012). "Indonesia". The World Factbook. Retrieved 6 April 2012.
- https://unstats.un.org/unsd/demographic-social/meetings/2021/egm-covid19-census-20210209/docs/s03-04-IDN.pdf
External links
- Indonesian Central Bureau of Statistics (in Indonesian)
- CIA World Factbook article on Indonesia
- On Indonesians of Arab descent
- United Nations "World Population Prospects": Country Profile - Indonesia
| Sumatra |
|
|---|---|
| Java | |
| Kalimantan | |
| Sulawesi | |
| Papua | |
| Lesser Sunda Islands | |
| Maluku Islands | |
| Non-indigenous | |

| Sovereign states |
|
|---|---|
| States with limited recognition | |
| Dependencies and other territories | |
| |