North Down (Assembly constituency)
North Down (Irish: An Dún Thuaidh, Ulster Scots: North Doon) is a constituency in the Northern Ireland Assembly.
| North Down | |
|---|---|
| Northern Ireland Assembly Parliamentary Constituency | |
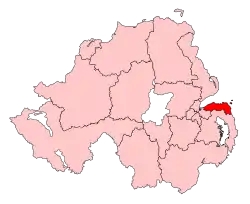 North Down shown within Northern Ireland | |
| Current constituency | |
| Created | 1973 |
| Seats | 6 (1996–2016) 5 (2017–) |
| MLAs | |
| Districts | Ards and North Down Borough Council |
The seat was first used for a Northern Ireland-only election for the Northern Ireland Assembly, 1973. It usually shares boundaries with the North Down UK Parliament constituency, however the boundaries of the two constituencies were slightly different from 1983 to 1986 as the Assembly boundaries had not caught up with Parliamentary boundary changes and from 1996 to 1997 when members of the Northern Ireland Forum had been elected from the newly drawn Parliamentary constituencies but the 51st Parliament of the United Kingdom, elected in 1992 under the 1983–95 constituency boundaries, was still in session.
Members were then elected from the constituency to the 1975 Constitutional Convention, the 1982 Assembly, the 1996 Forum and then to the current Assembly from 1998.
For further details of the history and boundaries of the constituency, see North Down (UK Parliament constituency).
Members
Note: The columns in this table are used only for presentational purposes, and no significance should be attached to the order of columns. For details of the order in which seats were won at each election, see the detailed results of that election.
Elections
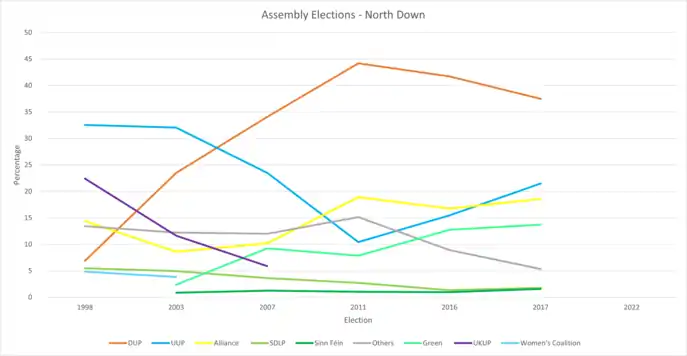
2022
| Party | Candidate | FPv% | Count | |
|---|---|---|---|---|
| 1 | ||||
| Independent | Chris Carter | |||
| UUP | Alan Chambers | |||
| DUP | Stephen Dunne | |||
| Ind U | Alex Easton | |||
| Alliance | Connie Egan | |||
| DUP | Jennifer Gilmour | |||
| TUV | John Gordon | |||
| UUP | Naomi McBurney | |||
| Sinn Féin | Thérèse McCartney | |||
| Independent | Ray McKimm | |||
| Alliance | Andrew Muir | |||
| NI Conservatives | Matthew Robinson | |||
| SDLP | Déirdre Vaughan | |||
| Green (NI) | Rachel Woods | |||
2017
| Party | Candidate | FPv% | Count | |||||||
|---|---|---|---|---|---|---|---|---|---|---|
| 1 | 2 | 3 | 4 | 5 | 6 | 7 | ||||
| DUP | Alex Easton | 21.29% | 8,034 | |||||||
| UUP | Alan Chambers | 18.95% | 7,151 | |||||||
| Alliance | Stephen Farry | 18.59% | 7,014 | |||||||
| DUP | Gordon Dunne | 16.21% | 6,118 | 7,678.68 | ||||||
| Green (NI) | Steven Agnew | 13.72% | 5,178 | 5,220.24 | 5,320.78 | 5,388.22 | 5,782.32 | 5,979.96 | 6,160.5 | |
| UUP | William Cudworth | 2.55% | 964 | 1,029.12 | 1,881.62 | 2,585.3 | 2,690.5 | 2,726.22 | 3,058.06 | |
| Independent | Melanie Kennedy | 3.30% | 1,246 | 1,285.82 | 1,371.62 | 1,389.86 | 1,429.86 | 1,503.96 | 1,596.88 | |
| SDLP | Caoímhe McNeill | 1.80% | 679 | 681.86 | 686.26 | 707.14 | 800.54 | 1,178 | 1,202.88 | |
| NI Conservatives | Frank Shivers | 1.70% | 641 | 654.2 | 740.66 | 756.14 | 777.24 | 801.88 | ||
| Sinn Féin | Kieran Maxwell | 1.57% | 591 | 591.22 | 591.88 | 592.6 | 604.5 | |||
| Independent | Chris Carter | 0.24% | 92 | 94.2 | 115.98 | 119.1 | 126.7 | |||
| Independent | Gavan Reynolds | 0.08% | 31 | 32.54 | 37.38 | 38.34 | 40.44 | |||
| Electorate: 64,461 Valid: 37,739 (58.55%) Spoilt: 435 Quota: 6,290 Turnout: 38,174 (59.22%) | ||||||||||
2016
| Party | Candidate | FPv% | Count | |||||||||||
|---|---|---|---|---|---|---|---|---|---|---|---|---|---|---|
| 1 | 2 | 3 | 4 | 5 | 6 | 7 | 8 | 9 | 10 | 11 | ||||
| DUP | Alex Easton | 19.72% | 6,357 | |||||||||||
| DUP | Gordon Dunne | 12.42% | 4,004 | 4,610.48 | ||||||||||
| Green (NI) | Steven Agnew | 12.75% | 4,109 | 4,142.32 | 4,229.44 | 4,239.56 | 4,310.56 | 4,490.12 | 4,523.2 | 4,607.2 | ||||
| UUP | Alan Chambers | 10.16% | 3,275 | 3,379.16 | 3,387.16 | 3,465.24 | 3,467.24 | 3,482.24 | 3,644.08 | 3,757.76 | 3,931.28 | 4,174.92 | 5,264.92 | |
| DUP | Peter Weir | 9.57% | 3,085 | 3,890.28 | 3,892.56 | 3,904.04 | 3,906.04 | 3,910.32 | 4,032.6 | 4,112.96 | 4,385.72 | 4,588.76 | 4,712.76 | |
| Alliance | Stephen Farry | 9.35% | 3,012 | 3,036.92 | 3,051.2 | 3,063.2 | 3,090.2 | 3,289.04 | 3,298.04 | 3,372.6 | 3,410.72 | 3,834.96 | 4,049.36 | |
| Alliance | Andrew Muir | 7.41% | 2,387 | 2,395.96 | 2,407.24 | 2,415.8 | 2,437.8 | 2,521.8 | 2,526.8 | 2,583.8 | 2,613.8 | 2,920.64 | 3,076.2 | |
| UUP | Carl McClean | 4.64% | 1,495 | 1,545.68 | 1,549.68 | 1,640.72 | 1,642 | 1,652 | 1,719.08 | 1,818.76 | 1,902.88 | 2,054.4 | ||
| Independent | Brian Wilson | 4.39% | 1,415 | 1,430.12 | 1,449.4 | 1,451.24 | 1,467.24 | 1,512.24 | 1,519.8 | 1,580.36 | 1,678.48 | |||
| UKIP | Bill Piper | 2.11% | 681 | 706.48 | 706.76 | 716.6 | 722.6 | 730.6 | 902.6 | 955.72 | ||||
| NI Conservatives | Frank Shivers | 2.09% | 672 | 683.76 | 686.76 | 693.4 | 694.04 | 696.04 | 713.04 | |||||
| TUV | John Brennan | 1.89% | 610 | 641.92 | 641.92 | 646.76 | 646.76 | 650.76 | ||||||
| SDLP | Conal Browne | 1.32% | 426 | 428.24 | 441.24 | 441.52 | 589.52 | |||||||
| Sinn Féin | Therese McCartney | 0.95% | 307 | 307.56 | 314.84 | 314.84 | ||||||||
| UUP | Chris Eisenstadt | 0.67% | 217 | 234.92 | 235.92 | |||||||||
| NI Labour | Maria Lourenco | 0.55% | 177 | 180.08 | ||||||||||
| Electorate: 65,760 Valid: 32,229 (49.01%) Spoilt: 368 Quota: 4,605 Turnout: 32,597 (49.57%) | ||||||||||||||
2011
| Party | Candidate | FPv% | Count | |||||||||||
|---|---|---|---|---|---|---|---|---|---|---|---|---|---|---|
| 1 | 2 | 3 | 4 | 5 | 6 | 7 | 8 | 9 | 10 | 11 | ||||
| DUP | Alex Easton | 18.42% | 5,175 | |||||||||||
| DUP | Gordon Dunne | 13.31% | 3,741 | 4,120.96 | ||||||||||
| DUP | Peter Weir | 12.44% | 3,496 | 4,101.36 | ||||||||||
| UUP | Leslie Cree | 5.64% | 1,585 | 1,609.38 | 1,610.38 | 1,678.3 | 1,691.53 | 2,795.81 | 2,853.34 | 3,310.34 | 3,361.02 | 4,410.02 | ||
| Alliance | Stephen Farry | 11.44% | 3,131 | 3,152.62 | 3,173.31 | 3,218.31 | 3,486 | 3,514.92 | 3,521.52 | 3,738.59 | 3,744.89 | 4,077.89 | ||
| Green (NI) | Steven Agnew | 7.85% | 2,207 | 2,220.34 | 2,261.57 | 2,314.57 | 2,552.8 | 2,605.18 | 2,614.64 | 2,811.82 | 2,819.8 | 3,193.37 | 3,229.37 | |
| Alliance | Anne Wilson | 7.47% | 2,100 | 2,115.18 | 2,134.41 | 2,171.64 | 2,447.64 | 2,482.79 | 2,492.36 | 2,658.65 | 2,664.32 | 3,078.03 | 3,130.03 | |
| Independent | Alan McFarland | 6.69% | 1,879 | 1,905.45 | 1,910.68 | 2,012.29 | 2,048.29 | 2,083.44 | 2,094.88 | 2,604.39 | 2,619.16 | |||
| Independent | Alan Chambers | 6.28% | 1,765 | 1,795.13 | 1,796.13 | 1,862.36 | 1,893.59 | 1,980.05 | 1,989.29 | |||||
| UUP | Colin Breen | 4.78% | 1,343 | 1,358.64 | 1,359.64 | 1,443.25 | 1,449.17 | |||||||
| SDLP | Liam Logan | 2.73% | 768 | 771.91 | 952.91 | 960.91 | ||||||||
| UKIP | Fred McGlade | 2.19% | 615 | 623.97 | 623.97 | |||||||||
| Sinn Féin | Conor Kennan | 1.04% | 293 | 294.61 | ||||||||||
| Electorate: 62,170 Valid: 28,098 (45.20%) Spoilt: 430 Quota: 4,015 Turnout: 28,528 (45.89%) | ||||||||||||||
2007
| Party | Candidate | FPv% | Count | ||||||||||
|---|---|---|---|---|---|---|---|---|---|---|---|---|---|
| 1 | 2 | 3 | 4 | 5 | 6 | 7 | 8 | 9 | 10 | ||||
| DUP | Alex Easton | 16.11% | 4,946 | ||||||||||
| Alliance | Stephen Farry | 10.20% | 3,131 | 3,134.96 | 3,143.96 | 3,202.07 | 3,337.07 | 3,511.07 | 3,875.29 | 4,466.29 | |||
| UUP | Leslie Cree | 9.56% | 2,937 | 2,952.73 | 2,965.84 | 3,016.95 | 3,112.06 | 3,393.39 | 3,466.39 | 3,530.5 | 3,788.72 | 4,686.72 | |
| Green (NI) | Brian Wilson | 9.25% | 2,839 | 2,843.07 | 2,855.07 | 2,928.18 | 3,059.4 | 3,208.62 | 3,471.95 | 4,113.06 | 4,333.72 | 4,571.72 | |
| DUP | Peter Weir | 10.99% | 3,376 | 3,507.23 | 3,513.45 | 3,566.33 | 3,614.77 | 3,688.32 | 3,748.65 | 3,754.87 | 4,231.49 | 4,380.47 | |
| UUP | Alan McFarland | 7.31% | 2,245 | 2,250.5 | 2,252.5 | 2,282.61 | 2,401.72 | 2,481.49 | 2,579.49 | 2,641.49 | 2,941.03 | 3,986.13 | |
| DUP | Alan Graham | 6.99% | 2,147 | 2,501.31 | 2,509.42 | 2,559.52 | 2,595.18 | 2,700.5 | 2,736.83 | 2,746.49 | 3,185.47 | 3,255.23 | |
| UUP | Marion Smith | 6.83% | 2,098 | 2,102.62 | 2,106.62 | 2,162.95 | 2,234.39 | 2,330.72 | 2,397.94 | 2,457.05 | 2,641.49 | ||
| UK Unionist | Robert McCartney | 5.88% | 1,806 | 1,815.57 | 1,823.68 | 1,861.67 | 1,949.67 | 2,043.89 | 2,098.89 | 2,118.89 | |||
| SDLP | Liam Logan | 3.63% | 1,115 | 1,116.1 | 1,118.1 | 1,382.1 | 1,399.1 | 1,427.43 | 1,674.43 | ||||
| Independent | Brian Rowan | 3.89% | 1,194 | 1,195.32 | 1,202.32 | 1,241.43 | 1,290.43 | 1,376.43 | |||||
| Independent | Alan Chambers | 3.68% | 1,129 | 1,133.07 | 1,172.07 | 1,190.18 | 1,257.29 | ||||||
| NI Conservatives | James Leslie | 2.81% | 864 | 866 | 872 | 888 | |||||||
| Sinn Féin | Deaglan Page | 1.27% | 390 | 390 | 391 | ||||||||
| PUP | Elaine Martin | 1.20% | 367 | 371 | 376 | ||||||||
| Independent | Christopher Carter | 0.40% | 123 | 124 | |||||||||
| Electorate: 57,525 Valid: 30,707 (53.38%) Spoilt: 223 Quota: 4,387 Turnout: 30,930 (53.77%) | |||||||||||||
2003
| Party | Candidate | FPv% | Count | ||||||||||||||
|---|---|---|---|---|---|---|---|---|---|---|---|---|---|---|---|---|---|
| 1 | 2 | 3 | 4 | 5 | 6 | 7 | 8 | 9 | 10 | 11 | 12 | 13 | 14 | ||||
| UUP | Leslie Cree | 12.65% | 3,900 | 3,908 | 3,919 | 3,920 | 3,950 | 3,989 | 4,019 | 4,032 | 4,073 | 4,305 | 4,402 | 4,482 | |||
| Alliance | Eileen Bell | 6.33% | 1,951 | 1,957 | 1,962 | 1,970 | 1,983 | 1,992 | 2,008 | 2,595 | 2,820 | 2,946 | 3,602 | 4,137 | 5,237 | ||
| UUP | Alan McFarland | 11.09% | 3,421 | 3,429 | 3,437 | 3,439 | 3,467 | 3,514 | 3,557 | 3,570 | 3,606 | 3,730 | 3,833 | 4,083 | 4,292 | 4,502 | |
| UK Unionist | Robert McCartney | 10.94% | 3,374 | 3,387 | 3,485 | 3,488 | 3,513 | 3,590 | 3,639 | 3,648 | 3,675 | 3,847 | 3,912 | 4,046 | 4,072 | 4,102 | |
| DUP | Peter Weir | 11.92% | 3,675 | 3,681 | 3,704 | 3,704 | 3,761 | 3,802 | 3,822 | 3,826 | 3,839 | 3,906 | 3,922 | 4,018 | 4,026 | 4,031 | |
| DUP | Alex Easton | 11.58% | 3,570 | 3,579 | 3,589 | 3,589 | 3,611 | 3,650 | 3,663 | 3,667 | 3,689 | 3,770 | 3,783 | 3,821 | 3,827 | 3,839 | |
| UUP | Diana Peacocke | 8.32% | 2,566 | 2,568 | 2,587 | 2,589 | 2,623 | 2,636 | 2,677 | 2,688 | 2,729 | 2,795 | 2,934 | 3,065 | 3,258 | 3,418 | |
| SDLP | Liam Logan | 4.93% | 1,519 | 1,522 | 1,523 | 1,732 | 1,734 | 1,738 | 1,741 | 1,785 | 1,851 | 1,870 | 2,077 | 2,158 | |||
| Independent | Brian Wilson | 4.38% | 1,350 | 1,355 | 1,357 | 1,359 | 1,371 | 1,415 | 1,429 | 1,437 | 1,489 | 1,598 | 1,718 | ||||
| NI Women's Coalition | Jane Morrice | 3.83% | 1,181 | 1,188 | 1,192 | 1,201 | 1,219 | 1,242 | 1,259 | 1,287 | 1,478 | 1,587 | |||||
| Independent | Alan Chambers | 3.49% | 1,077 | 1,099 | 1,102 | 1,102 | 1,119 | 1,185 | 1,206 | 1,214 | 1,242 | ||||||
| Green (NI) | John Barry | 2.37% | 730 | 733 | 734 | 748 | 762 | 768 | 786 | 800 | |||||||
| Alliance | Stephen Farry | 2.28% | 704 | 708 | 711 | 722 | 728 | 740 | 751 | ||||||||
| NI Conservatives | Julian Robertson | 1.59% | 491 | 492 | 497 | 497 | 501 | 508 | |||||||||
| Independent | Alan Field | 1.39% | 428 | 430 | 432 | 432 | 448 | ||||||||||
| PUP | David Rose | 1.02% | 316 | 317 | 327 | 327 | |||||||||||
| Sinn Féin | Maria George | 0.86% | 264 | 265 | 265 | ||||||||||||
| UKIP | Tom Sheridan | 0.68% | 209 | 210 | |||||||||||||
| Independent | Christopher Carter | 0.35% | 109 | ||||||||||||||
| Electorate: 57,422 Valid: 30,835 (53.70%) Spoilt: 481 Quota: 4,406 Turnout: 31,316 (54.54%) | |||||||||||||||||
1998
| Party | Candidate | FPv% | Count | ||||||||||||
|---|---|---|---|---|---|---|---|---|---|---|---|---|---|---|---|
| 1 | 2 | 3 | 4 | 5 | 6 | 7 | 8 | 9 | 10 | 11 | 12 | ||||
| UK Unionist | Robert McCartney | 21.94% | 8,188 | ||||||||||||
| UUP | Alan McFarland | 12.47% | 4,653 | 4,856 | 4,984.4 | 5,108.45 | 5,274.3 | 5,466.3 | |||||||
| UUP | John Gorman | 12.65% | 4,719 | 4,798.45 | 4,922.05 | 4,953.65 | 5,049.1 | 5,346.1 | |||||||
| Alliance | Eileen Bell | 9.83% | 3,669 | 3,685.8 | 3,795.25 | 3,800.6 | 4,268.75 | 4,374.15 | 4,579.35 | 4,588.05 | 5,985.05 | ||||
| NI Women's Coalition | Jane Morrice | 4.85% | 1,808 | 1,836 | 1,918.45 | 1,932.25 | 2,056.3 | 2,232.35 | 2,460.2 | 2,478.47 | 2,719.82 | 3,027.62 | 3,085.82 | 4,897.71 | |
| UUP | Peter Weir | 7.44% | 2,775 | 2,850.6 | 2,890.4 | 2,929.8 | 3,049.7 | 3,179.9 | 3,664.3 | 3,747.82 | 3,920.32 | 4,121.74 | 4,593.34 | 4,751.06 | |
| DUP | Alan Graham | 4.18% | 1,558 | 1,829.25 | 1,879.65 | 2,747.65 | 2,778.1 | 2,929.45 | 3,136.85 | 3,147.29 | 3,167.69 | 3,171.47 | 4,423.67 | 4,443.45 | |
| SDLP | Marietta Farrell | 5.49% | 2,048 | 2,050.8 | 2,084.8 | 2,086.15 | 2,134.15 | 2,193.85 | 2,236.85 | 2,238.59 | 2,326.59 | 2,449.71 | 2,458.1 | ||
| UK Unionist | Elizabeth Roche | 0.46% | 173 | 1,798.05 | 1,846.5 | 1,992.9 | 2,018.9 | 2,062.95 | 2,225.2 | 2,230.42 | 2,255.57 | 2,264.75 | |||
| Alliance | Gavin Walker | 4.55% | 1,699 | 1,709.5 | 1,753.2 | 1,757.9 | 1,910.25 | 1,965.95 | 2,089.35 | 2,095.44 | |||||
| Independent | Alan Chambers | 3.71% | 1,382 | 1,455.15 | 1,531.5 | 1,554.05 | 1,644.85 | 1,750.7 | |||||||
| PUP | Stewart Currie | 3.69% | 1,376 | 1,416.25 | 1,521.8 | 1,556.05 | 1,582.8 | ||||||||
| Independent | Brian Wilson | 3.56% | 1,327 | 1,360.6 | 1,389.35 | 1,396.4 | |||||||||
| DUP | St Clair McAlister | 2.71% | 1,013 | 1,291.25 | 1,354.1 | ||||||||||
| NI Conservatives | Leonard Fee | 0.90% | 337 | 365 | |||||||||||
| Ulster Democratic | Tom Lindsay | 0.71% | 265 | 294.75 | |||||||||||
| Labour Party NI | Vanessa Baird-Gunning | 0.57% | 212 | 217.95 | |||||||||||
| Independent | Christopher Carter | 0.19% | 72 | 77 | |||||||||||
| Natural Law | Andrea Gribben | 0.10% | 39 | 42 | |||||||||||
| Electorate: 62,942 Valid: 37,313 (59.28%) Spoilt: 561 Quota: 5,331 Turnout: 37,874 (60.17%) | |||||||||||||||
1996 Forum
Successful candidates are shown in bold.[8]
| Party | Candidate(s) | Votes | Percentage | |
|---|---|---|---|---|
| UUP | Peter Weir Alan McFarland Roy Bradford John Shields Irene Cree |
9,270 | 25.6 | |
| UK Unionist | Robert McCartney Valerie Kinghan Patricia Watson |
7,579 | 20.9 | |
| DUP | St Clair McAlister Ruby Cooling Cecil Noble |
6,699 | 18.5 | |
| Alliance | Oliver Napier Brian Wilson Eileen Bell Larry Thompson Jane Copeland |
6,186 | 17.1 | |
| SDLP | Owen Adams John Burke |
1,798 | 5.0 | |
| PUP | Victor Ash Samuel Curry Neil Mehaffy Kenneth Sterrit |
1,694 | 4.7 | |
| Ulster Democratic | James McCullough Thomas Lindsay |
651 | 1.8 | |
| NI Women's Coalition | Emma McGuigan Ann Marie Foster Jane Morrice |
496 | 1.4 | |
| NI Conservatives | Ann Thompson Bruce Mulligan |
444 | 1.2 | |
| Independent Chambers | Alan Chambers James Arbuthnot Robert Irvine |
334 | 0.9 | |
| Green (NI) | Paddy McEvoy Mary Ringland |
283 | 0.8 | |
| Sinn Féin | Máirtín Ó Muilleoir John Smith |
275 | 0.8 | |
| Labour coalition | John Magennis Sean McGouran |
171 | 0.5 | |
| Independent DUP | Thomas O'Brien William Baxter |
97 | 0.3 | |
| Democratic Left | Daryl Armitage Tim Davis |
95 | 0.3 | |
| Workers' Party | Dessie O'Hagan Colum Mullan |
60 | 0.2 | |
| Ulster Independence | Geoffrey Watson Glenn Pollock |
49 | 0.1 | |
| Independent Voice | Christopher Carter Fidelma Carter |
49 | 0.1 | |
| Natural Law | Peter McGowan Thomas Mullins |
15 | 0.0 | |
1982 Assembly Election
| Party | Candidate | FPv% | Count | |||||||||||||
|---|---|---|---|---|---|---|---|---|---|---|---|---|---|---|---|---|
| 1 | 2 | 3 | 4 | 5 | 6 | 7 | 8 | 9 | 10 | 11 | 12 | 13 | ||||
| UPUP | James Kilfedder | 25.56% | 13,958 | |||||||||||||
| UUP | John Taylor | 10.71% | 5,852 | 7,257.62 | ||||||||||||
| DUP | Simpson Gibson | 8.24% | 4,500 | 4,855.68 | 4,913.01 | 4,941.9 | 4,985.37 | 6,391.37 | ||||||||
| Alliance | John Cushnahan | 8.09% | 4,416 | 4,491.81 | 4,501.12 | 4,501.69 | 4,936.05 | 4,943.05 | 6,068.76 | 6,069.68 | ||||||
| Alliance | Lord Dunleath | 7.03% | 3,841 | 4,209.79 | 4,283.78 | 4,292.63 | 4,881.43 | 4,918.34 | 5,960.62 | 5,961.54 | 6,161.54 | |||||
| DUP | Wesley Pentland | 6.12% | 3,340 | 3,621.01 | 3,704.8 | 3,723.08 | 3,760.71 | 4,089.24 | 4,097.24 | 4,345.64 | 4,486.78 | 6,930.78 | ||||
| UUP | Robert McCartney | 6.92% | 3,782 | 4,402.73 | 4,583.54 | 4,606.82 | 4,956.52 | 5,015.07 | 5,030.07 | 5,033.52 | 5,860.36 | 5,978.16 | 6,131.39 | |||
| UUP | William Bleakes | 4.93% | 2,692 | 2,929.69 | 3,027.2 | 3,047.93 | 3,202.08 | 3,241.61 | 3,244.18 | 3,246.02 | 4,401.83 | 4,778.58 | 5,278.92 | 5,336.52 | 5,383.79 | |
| UPUP | George Green | 1.75% | 958 | 4,265.71 | 4,471.51 | 4,507.97 | 4,595.57 | 4,679.84 | 4,685.41 | 4,689.55 | 4,967.01 | 5,126.75 | 5,330.73 | 5,364.93 | 5,377.98 | |
| DUP | Charles Poots | 5.15% | 2,811 | 3,024.18 | 3,083.47 | 3,100.16 | 3,124.45 | 3,315.55 | 3,317.55 | 3,362.4 | 3,436.27 | |||||
| UUP | Hazel Bradford | 3.60% | 1,966 | 2,447.65 | 2,693.63 | 2,722.22 | 2,931.18 | 3,028.23 | 3,032.86 | 3,037.69 | ||||||
| SDLP | Patrick Doherty | 4.64% | 2,536 | 2,546.26 | 2,547.73 | 2,548.73 | 2,566.73 | 2,567.73 | ||||||||
| DUP | Thomas Gourley | 3.77% | 2,060 | 2,276.6 | 2,315.31 | 2,333.57 | 2,392.97 | |||||||||
| Alliance | Brian Wilson | 1.93% | 1,055 | 1,117.13 | 1,135.26 | 1,136.4 | ||||||||||
| UUP | David McNarry | 1.23% | 671 | 827.18 | 923.71 | 935.34 | ||||||||||
| UUUP | Robert Gabbey | 0.33% | 181 | 217.48 | 228.75 | |||||||||||
| Electorate: 103,619 Valid: 54,619 (52.71%) Spoilt: 1,182 Quota: 6,069 Turnout: 55,801 (53.85%) | ||||||||||||||||
1975 Constitutional Convention
| Party | Candidate | FPv% | Count | ||||||||
|---|---|---|---|---|---|---|---|---|---|---|---|
| 1 | 2 | 3 | 4 | 5 | 6 | 7 | 8 | ||||
| UUP | James Kilfedder | 37.54% | 21,693 | ||||||||
| UUP | John Taylor | 12.53% | 7,238 | ||||||||
| Vanguard | George Green | 7.63% | 4,408 | 8,063.68 | |||||||
| DUP | Charles Poots | 5.13% | 2,962 | 6,778.16 | 7,072.24 | 7,137.28 | 7,209.8 | 7,228.64 | |||
| Alliance | Lord Dunleath | 7.99% | 4,616 | 5,109.68 | 5,119.12 | 5,201.96 | 5,569.68 | 7,182.4 | 9,226.4 | ||
| Alliance | Bertie McConnell | 5.36% | 3,099 | 3,420.64 | 3,427.52 | 3,549.88 | 3,619.56 | 4,377.72 | 5,710.12 | 7,064.12 | |
| Unionist Party NI | Viscount Brookeborough | 6.15% | 3,555 | 4,435.6 | 4,459.12 | 4,873.68 | 6,340.04 | 6,416.04 | 6,480.96 | 6,535.96 | |
| UUP | Neil Oliver | 2.18% | 1,257 | 5,727.32 | 6,180.12 | 6,333.24 | 6,453.16 | 6,494.36 | 6,508.72 | 6,515.72 | |
| SDLP | Sean Hollywood | 6.90% | 3,988 | 4,005.68 | 4,006.48 | 4,014.32 | 4,056 | 4,150.52 | |||
| Alliance | Keith Jones | 4.20% | 2,424 | 2,550.48 | 2,553.36 | 2,586.2 | 2,646 | ||||
| Unionist Party NI | William Brownlow | 2.83% | 1,638 | 1,939.92 | 1,950.8 | 2,281.84 | |||||
| Unionist Party NI | Robert Campbell | 1.56% | 901 | 1,263.44 | 1,288.4 | ||||||
| Electorate: 93,884 Valid: 57,779 (61.54%) Spoilt: 989 Quota: 7,223 Turnout: 58,768 (62.60%) | |||||||||||
1973 Assembly Election
| Party | Candidate | FPv% | Count | |||||||||||||
|---|---|---|---|---|---|---|---|---|---|---|---|---|---|---|---|---|
| 1 | 2 | 3 | 4 | 5 | 6 | 7 | 8 | 9 | 10 | 11 | 12 | 13 | ||||
| UUP | James Kilfedder | 33.66% | 20,684 | |||||||||||||
| UUP | John Brooke | 10.02% | 6,160 | 9,168.25 | ||||||||||||
| DUP | Charles Poots | 7.10% | 4,364 | 6,488.36 | 6,543.54 | 6,546.8 | 6,711.32 | 6,713.84 | 6,793.73 | 7,354.97 | 7,512.06 | 7,520.06 | 7,678.2 | 10,253.2 | ||
| Alliance | Lord Dunleath | 7.29% | 4,482 | 4,725.81 | 4,755.26 | 4,781.09 | 4,921.26 | 5,690.95 | 6,230.33 | 6,239.68 | 6,304.89 | 7,364.15 | 7,557.46 | 7,625.26 | 7,663.26 | |
| UUP | Robert Campbell | 6.12% | 3,760 | 4,936.21 | 5,212.73 | 5,215.3 | 5,238.4 | 5,250.55 | 5,331.36 | 5,365.23 | 5,638.74 | 5,644.74 | 6,371.19 | 6,966.27 | 7,307.27 | |
| UUP | William Brownlow | 4.26% | 2,620 | 3,776.05 | 4,424.88 | 4,426.88 | 4,445.39 | 4,455.85 | 4,642.62 | 4,698.18 | 5,100.23 | 5,168.17 | 6,097.92 | 6,524.05 | 6,630.05 | |
| Alliance | Bertie McConnell | 5.32% | 3,271 | 3,374.32 | 3,382.38 | 3,443.64 | 3,707.77 | 4,556.89 | 5,051.98 | 5,059.87 | 5,097.74 | 6,126.74 | 6,257.92 | 6,311.28 | 6,331.28 | |
| UUP | Andrew Donaldson | 3.17% | 1,950 | 3,320.25 | 3,517.72 | 3,525.66 | 3,544.99 | 3,556.88 | 3,621.11 | 3,660.44 | 4,542.17 | 4,551.43 | 5,390.1 | 5,903.72 | 6,097.72 | |
| Vanguard | George Green | 3.95% | 2,425 | 3,304.48 | 3,336.1 | 3,340.67 | 3,535.82 | 3,541.71 | 3,579.32 | 4,933.91 | 5,053.06 | 5,061.06 | 5,172.69 | |||
| UUP | Kathleen McClure | 2.92% | 1,796 | 2,518.61 | 2,636.41 | 2,637.41 | 2,672.78 | 2,722.71 | 2,771.17 | 2,846.2 | 3,191.62 | 3,209.25 | ||||
| SDLP | Patrick McHenry | 4.61% | 2,833 | 2,835.52 | 2,835.52 | 2,846.52 | 2,861.15 | 2,917.15 | 3,121.15 | 3,123.41 | 3,125.35 | |||||
| UUP | Hans Jess | 2.00% | 1,227 | 2,175.78 | 2,244.91 | 2,247.8 | 2,258.41 | 2,270.82 | 2,307.11 | 2,358.4 | ||||||
| Vanguard | Kenneth Leckey | 2.10% | 1,290 | 1,981.11 | 1,991.65 | 1,992.91 | 2,224.31 | 2,225.57 | 2,245.61 | |||||||
| NI Labour | William Allen | 2.20% | 1,354 | 1,441.57 | 1,445.91 | 1,908.56 | 1,928.08 | 1,969.22 | ||||||||
| Alliance | Cecilia Linehan | 2.43% | 1,493 | 1,547.18 | 1,549.04 | 1,565.56 | 1,839.49 | |||||||||
| Alliance | John Marks | 1.14% | 699 | 731.76 | 735.79 | 754.05 | ||||||||||
| Vanguard | David Trimble | 0.73% | 446 | 658.94 | 669.48 | 672.48 | ||||||||||
| NI Labour | Kenneth Young | 0.98% | 601 | 628.09 | 629.64 | |||||||||||
| Electorate: 89,682 Valid: 61,455 (68.53%) Spoilt: 755 Quota: 7,682 Turnout: 62,210 (69.37%) | ||||||||||||||||
References
- "Statement of Persons Nominated - North Down". Retrieved 8 April 2022.
{{cite web}}: CS1 maint: url-status (link) - "NI Assembly Election 2017". EONI. Archived from the original on 19 August 2021. Retrieved 21 August 2021.
- "NI Assembly Election 2016". EONI. Archived from the original on 19 August 2021. Retrieved 21 August 2021.
- "NI Assembly Election 2011" (PDF). EONI. Archived (PDF) from the original on 21 August 2021. Retrieved 21 August 2021.
- "NI Assembly Election 2007". EONI. Archived from the original on 19 August 2021. Retrieved 21 August 2021.
- "NI Assembly Election 2003". EONI. Archived from the original on 6 August 2019. Retrieved 21 August 2021.
- "NI Assembly Election 1998". EONI. Archived from the original on 20 March 2021. Retrieved 21 August 2021.
- "1996 Candidates – North Down, Northern Ireland Elections". Archived from the original on 23 June 2018. Retrieved 7 October 2007.
- "NI Assembly Election 1982". EONI. Archived from the original on 19 August 2021. Retrieved 21 August 2021.
- "NI Convention Election 1975". EONI. Archived from the original on 6 August 2019. Retrieved 21 August 2021.
- "NI Assembly Election 1973". EONI. Archived from the original on 6 August 2019. Retrieved 21 August 2021.
| Assembly |   | |
|---|---|---|
| Committees | ||
| Constituencies | ||
| Parties | ||
| Elections | ||
| Members |
| |
| Procedure | ||
| See also | ||