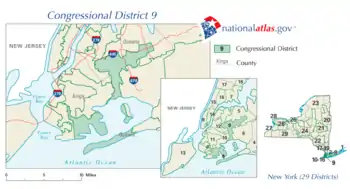
New York's 9th congressional district
New York's 9th congressional district is a congressional district for the United States House of Representatives in New York City, represented by Yvette Clarke.
| New York's 9th congressional district | |||
|---|---|---|---|
District boundaries | |||
| Representative |
| ||
| Distribution |
| ||
| Population (2019) | 720,316[1] | ||
| Median household income | $69,754[2] | ||
| Ethnicity |
| ||
| Cook PVI | D+32[3] | ||
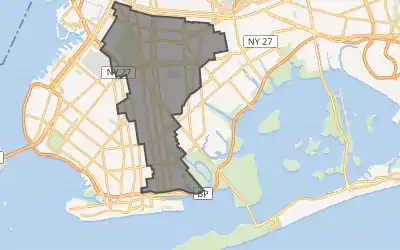
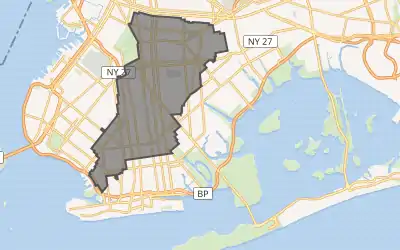
The district is located entirely within Brooklyn. It includes the neighborhoods of Brownsville, Crown Heights, East Flatbush, Flatbush, Kensington, Park Slope, Prospect Heights, Midwood, Sheepshead Bay, Marine Park, Gerritsen Beach, and Prospect Lefferts Gardens. Prospect Park, Grand Army Plaza and the Grand Army Plaza Greenmarket, the worldwide headquarters of the Chabad-Lubavitch Hasidic community, and the Brooklyn Children's Museum are located within this district, as well as, in the Prospect Heights neighborhood, the Brooklyn Museum of Art, the Brooklyn Botanic Garden, and the Central Library, or main branch, of the Brooklyn Public Library.
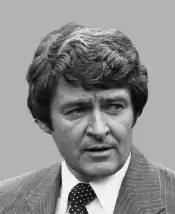
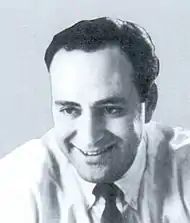
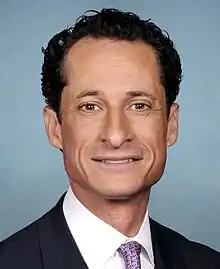
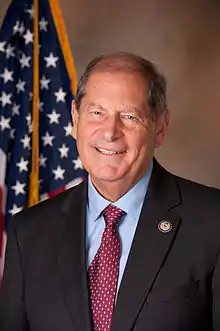
Prior to 2013, the district consisted primarily of middle-class white neighborhoods, including large Jewish, Italian, Irish, and Russian populations, in southern Brooklyn and south central Queens. Before redistricting, the Queens Tribune found that the district increasingly swung Republican following the September 11 attacks in 2001, when many police and firefighters were lost from the Rockaways.[4] Its rightward shift was also attributed to the increasing tendency of Orthodox Jews to vote for Republicans.[5] Its representation in Congress was reliably Democratic for decades, electing prominent liberals such as Chuck Schumer and Anthony Weiner, and, prior to that, Emanuel Celler and Elizabeth Holtzman (when the district was differently numbered). Anthony D. Weiner was Congressman from 1999 until he resigned on June 21, 2011. Republican Bob Turner succeeded Weiner after winning the special election on September 13, 2011. However, the previous 9th District was eliminated, after New York lost two districts in 2010 redistricting, and its territory was divided among several neighboring districts.
After redistricting, Yvette Clarke now represents the district. The district has an African-American majority, and also includes most of the territory previously within the 11th District. It includes significant portions of Midwood, Brooklyn, however, that was previously within the 9th.
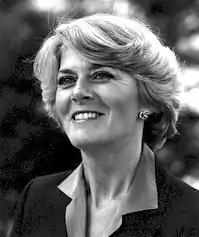
In the 1980s, the district was based in Astoria and surrounding neighborhoods in Queens. This iteration of the district gained national attention in 1984, when 9th District Rep. Geraldine Ferraro became the vice presidential candidate of the Democratic Party.
Recent results in presidential elections
| Year | Office | Results |
|---|---|---|
| 1992 | President | Clinton 59 – 32% |
| 1996 | President | Clinton 66 – 27% |
| 2000 | President | Gore 67 – 30% |
| 2004 | President | Kerry 56 – 44% |
| 2008 | President | Obama 84 – 15% |
| 2012 | President | Obama 85 – 14% |
| 2016 | President | Clinton 84 – 14% |
| 2020 | President | Biden 81 – 17% |
Components: past and present
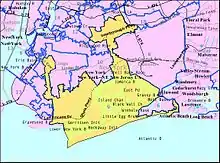
The 9th was historically a Queens district. Part of the old 9th became the 7th District in the 1992 redistricting when the present 9th absorbed much of the old 10th District based in Brooklyn.
- 1797–1803: Montgomery County
- 1803–1809: [data unknown/missing]
- 1809–1913: Montgomery County
- 1913–1945: Parts of Brooklyn, Queens
- 1945–1963: Parts of Brooklyn
- 1963–1993: Parts of Queens
- 1993–2013: Parts of Brooklyn, Queens
- 2013–present: Parts of Brooklyn
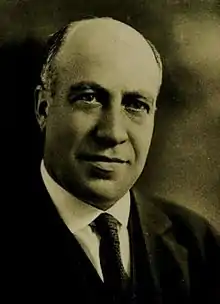
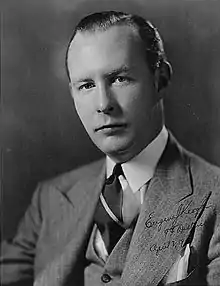
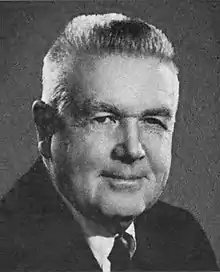
List of members representing the district

.jpg.webp)


.jpg.webp)

Recent election results
In New York elections, there are minor parties. Certain parties will invariably endorse either the Republican or Democratic candidate for every office; hence, the state electoral results contain both the party votes, and the final candidate votes (Listed as "Recap").
- [data unknown/missing]
| Party | Candidate | Votes | % | ±% | |
|---|---|---|---|---|---|
| Democratic | Fernando Wood (incumbent) | 15,620 | 64.8 | ||
| Young Democrat and Republican | William S. Hillyer | 4,789 | 19.8 | ||
| Republican | Morris Ellinger | 3,707 | 15.4 | ||
| Majority | 10,831 | 45.0 | |||
| Turnout | 24,116 | 100 | |||
- [data unknown/missing]
| Party | Candidate | Votes | % | ±% | |
|---|---|---|---|---|---|
| Democratic | Thomas J. Manton | 71,420 | 52.8 | ||
| Republican | Serphin R. Maltese | 63,910 | 47.2 | ||
| Majority | 7,510 | 5.6 | |||
| Turnout | 135,330 | 100 | |||
| Party | Candidate | Votes | % | ±% | |
|---|---|---|---|---|---|
| Democratic | Charles E. Schumer (incumbent) | 107,107 | 74.8 | ||
| Republican | Robert J. Verga | 30,488 | 21.3 | ||
| Conservative | Michael Mossa | 5,618 | 3.9 | ||
| Majority | 76,619 | 53.5 | |||
| Turnout | 143,213 | 100 | |||
| Party | Candidate | Votes | % | ±% | |
|---|---|---|---|---|---|
| Democratic | Anthony D. Weiner | 69,439 | 66.4 | -8.4 | |
| Republican | Louis Telano | 24,486 | 23.4 | +2.1 | |
| Liberal | Melinda Katz | 5,698 | 5.5 | +5.5 | |
| Conservative | Arthur J. Smith | 4,899 | 4.7 | +0.8 | |
| Majority | 44,953 | 43.0 | -10.5 | ||
| Turnout | 104,522 | 100 | -27.0 | ||
| Party | Candidate | Votes | % | ±% | |
|---|---|---|---|---|---|
| Democratic | Anthony D. Weiner (incumbent) | 98,983 | 68.4 | +2.0 | |
| Republican | Noach Dear | 45,649 | 31.6 | +8.2 | |
| Majority | 53,334 | 36.9 | -6.1 | ||
| Turnout | 144,632 | 100 | +38.4 | ||
| Party | Candidate | Votes | % | ±% | |
|---|---|---|---|---|---|
| Democratic | Anthony D. Weiner (incumbent) | 60,737 | 65.7 | -2.7 | |
| Republican | Alfred F. Donohue | 31,698 | 34.3 | +2.7 | |
| Majority | 29,039 | 31.4 | -5.5 | ||
| Turnout | 92,435 | 100 | -36.1 | ||
| Party | Candidate | Votes | % | ±% | |
|---|---|---|---|---|---|
| Democratic | Anthony D. Weiner (incumbent) | 113,025 | 71.3 | +5.6 | |
| Republican | Gerard J. Cronin | 45,451 | 28.7 | -5.6 | |
| Majority | 67,574 | 42.6 | +11.2 | ||
| Turnout | 158,476 | 100 | +71.4 | ||
| Party | Candidate | Votes | % | ±% | |
|---|---|---|---|---|---|
| Democratic | Anthony D. Weiner (incumbent) | 71,762 | 100 | +28.7 | |
| Majority | 71,762 | 100 | +57.4 | ||
| Turnout | 71,762 | 100 | -54.7 | ||
| Party | Candidate | Votes | % | ±% | |
|---|---|---|---|---|---|
| Democratic | Anthony D. Weiner (incumbent) | 112,205 | 93.1 | -6.9 | |
| Conservative | Alfred F. Donohue | 8,378 | 6.9 | +6.9 | |
| Majority | 103,827 | 86.2 | -13.8 | ||
| Turnout | 120,583 | 100 | +68.0 | ||
| Party | Candidate | Votes | % | ±% | |
|---|---|---|---|---|---|
| Democratic | Anthony D. Weiner (incumbent) | 67,011 | 60.8 | -32.3 | |
| Republican | Bob Turner | 43,129 | 39.2 | +39.2 | |
| Majority | 23,882 | 21.6 | -64.6 | ||
| Turnout | 110,140 | 100 | -8.7 | ||
| Democratic hold | |||||
| Party | Candidate | Votes | % | |||
|---|---|---|---|---|---|---|
| Republican | Bob Turner | 37,342 | 51.72 | |||
| Democratic | David Weprin | 33,656 | 46.62 | |||
| Socialist Workers | Chris Hoeppner | 143 | 0.2 | |||
| Write-In Votes | Multiple (49 Names) | 1,056 | 1.46 | |||
| Total votes | 72,197 | 100 | ||||
| Republican gain from Democratic | ||||||
| Party | Candidate | Votes | % | ||
|---|---|---|---|---|---|
| Democratic | Yvette D. Clarke (incumbent) | 181,455 | 89.3 | ||
| Republican | Lutchi Gayot | 20,901 | 10.3 | ||
| Reform | Joel Anabilah-Azumah | 779 | 0.4 | ||
| Majority | |||||
| Turnout | 203,135 | 100.0 | |||
| Party | Candidate | Votes | % | |
|---|---|---|---|---|
| Democratic | Yvette Clarke | 195,758 | 70.7 | |
| Working Families | Yvette Clarke | 34,463 | 12.4 | |
| Total | Yvette Clarke (incumbent) | 230,221 | 83.1 | |
| Republican | Constantin Jean-Pierre | 40,110 | 14.5 | |
| Conservative | Constantin Jean-Pierre | 3,840 | 1.4 | |
| Total | Constantin Jean-Pierre | 43,950 | 15.9 | |
| Libertarian | Gary Popkin | 1,644 | 0.6 | |
| SAM | Joel Azumah | 1,052 | 0.4 | |
| Total votes | 276,867 | 100.0 | ||
| Democratic hold | ||||
Historical district boundaries
See also
Notes
- "New York congressional districts by urban and rural population and land area". United States Census Bureau. June 8, 2017. Archived from the original on November 21, 2019. Retrieved November 21, 2019.
- "My Congressional District".
- "Introducing the 2021 Cook Political Report Partisan Voter Index". The Cook Political Report. April 15, 2021. Retrieved April 15, 2021.
- Feature Archived December 23, 2011, at the Wayback Machine. Queens Tribune (September 15, 2011). Retrieved on 2013-08-16.
- "Pro-Israel Republican Bob Turner wins Weiner's NY seat - World News - Jerusalem Post".
- "A New Nation Votes". elections.lib.tufts.edu. Retrieved June 12, 2020.
- The History of Political Parties in the State of New-York, from the Ratification of the Federal Constitution to 1840 by Jabez D. Hammond (4th ed., Vol. 1, H. & E. Phinney, Cooperstown, 1846), on page 115: "…Gen. John Williams who had changed from a zealous democrat to a most heated federalist."
- "A New Nation Votes". elections.lib.tufts.edu. Retrieved June 12, 2020.
- "A New Nation Votes". elections.lib.tufts.edu. Retrieved June 12, 2020.
- "A New Nation Votes". elections.lib.tufts.edu. Retrieved June 12, 2020.
- Mali, Meghashyam (June 20, 2011). "Weiner submits his letter of resignation". TheHill. Retrieved June 12, 2020.
- November Election, 1870. Complete Statement of the Official Canvass, in Detail of the Election Held November 8, 1870, Giving the Vote of Each Election District, with Proceedings of County And State... Vol. II. County of New York. 1871. p. 2030. Retrieved March 26, 2009.
{{cite book}}: CS1 maint: others (link)
References
- Martis, Kenneth C. (1989). The Historical Atlas of Political Parties in the United States Congress. New York: Macmillan Publishing Company.
- Martis, Kenneth C. (1982). The Historical Atlas of United States Congressional Districts. New York: Macmillan Publishing Company.
- Congressional Biographical Directory of the United States 1774–present
- "1996 House election data". Clerk of the House of Representatives.
- "1998 House election data". Clerk of the House of Representatives.
- "2000 House election data". Clerk of the House of Representatives. Archived from the original on September 29, 2006. Retrieved August 27, 2006.
- "2002 House election data". Clerk of the House of Representatives. Archived from the original on August 31, 2006. Retrieved August 27, 2006.
- "2004 House election data". Clerk of the House of Representatives. Archived from the original on September 1, 2006. Retrieved August 27, 2006.