North Carolina's 7th congressional district
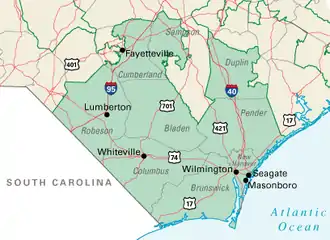
North Carolina's 7th congressional district stretches from Wilmington and the South Carolina border to the southern suburbs of Raleigh.
| North Carolina's 7th congressional district | |||
|---|---|---|---|
.png.webp) North Carolina's 7th congressional district - since January 3, 2021. | |||
| Representative |
| ||
| Distribution |
| ||
| Population (2019) | 816,402[2] | ||
| Median household income | $53,066[2] | ||
| Ethnicity |
| ||
| Cook PVI | R+11[3] | ||
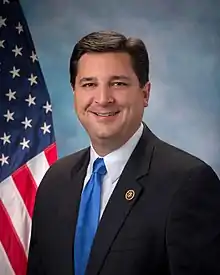
The district is represented by Rep. David Rouzer, a Republican. He has been in office since 2015.
From 2003 to 2013 it covered Bladen, Brunswick, Columbus, Cumberland, Duplin, New Hanover, Pender, Robeson, and Sampson counties.
On February 23, 2022, the North Carolina Supreme Court approved a new map which changed the 7th district boundaries to remove Duplin and Sampson Counties and part of Cumberland.[4]
List of members representing the district


Election results
| Party | Candidate | Votes | % | |
|---|---|---|---|---|
| Democratic | Mike McIntyre | 87,487 | 52.88 | |
| Republican | Bill Caster | 75,811 | 45.82 | |
| Libertarian | Chris Nubel | 1,573 | 0.95 | |
| Natural Law | Garrison King Frantz | 569 | 0.34 | |
| Majority | 11,676 | 7.06 | ||
| Total votes | 165,440 | 100.00 | ||
| Party | Candidate | Votes | % | ±% | |
|---|---|---|---|---|---|
| Democratic | Mike McIntyre (incumbent) | 124,366 | 91.25 | +38.37 | |
| Libertarian | Paul Meadows | 11,924 | 8.75 | +7.80 | |
| Majority | 112,442 | 82.50 | +75.44 | ||
| Total votes | 136,290 | 100.00 | -17.62 | ||
| Party | Candidate | Votes | % | ±% | |
|---|---|---|---|---|---|
| Democratic | Mike McIntyre (incumbent) | 160,185 | 69.75 | -21.5 | |
| Republican | James R. Adams | 66,463 | 28.94 | +28.94 | |
| Libertarian | Bob Burns | 3,018 | 1.31 | -7.44 | |
| Majority | 93,722 | 40.80 | -41.7 | ||
| Total votes | 229,666 | 100.00 | +68.51 | ||
| Party | Candidate | Votes | % | ±% | |
|---|---|---|---|---|---|
| Democratic | Mike McIntyre (incumbent) | 118,543 | 71.13 | +1.38 | |
| Republican | James R. Adams | 45,537 | 27.32 | -2.62 | |
| Libertarian | David Michael Brooks | 2,574 | 1.54 | +0.23 | |
| Majority | 73,006 | 43.81 | +3.01 | ||
| Total votes | 166,654 | 100.00 | -27.44 | ||
| Party | Candidate | Votes | % | ±% | |
|---|---|---|---|---|---|
| Democratic | Mike McIntyre (incumbent) | 180,382 | 73.19 | +2.26 | |
| Republican | Ken Plonk | 66,084 | 26.81 | -0.51 | |
| Majority | 114,298 | 46.37 | -2.56 | ||
| Total votes | 246,466 | 100.00 | 47.89 | ||
| Party | Candidate | Votes | % | ±% | |
|---|---|---|---|---|---|
| Democratic | Mike McIntyre (incumbent) | 101,787 | 72.80 | -0.39 | |
| Republican | Shirley Davis | 38,033 | 27.20 | +0.39 | |
| Majority | 63,754 | 45.60 | -0.77 | ||
| Total votes | 139,820 | 100.00 | -43.27 | ||
| Party | Candidate | Votes | % | ±% | |
|---|---|---|---|---|---|
| Democratic | Mike McIntyre (incumbent) | 215,383 | 68.84 | -3.96 | |
| Republican | Will Breazeale | 97,472 | 31.16 | +3.96 | |
| Majority | 117,911 | 37.69 | -7.91 | ||
| Total votes | 312,885 | 100.00 | 123.78 | ||
| Party | Candidate | Votes | % | ±% | |
|---|---|---|---|---|---|
| Democratic | Mike McIntyre (incumbent) | 113,957 | 53.68 | -15.16 | |
| Republican | Ilario Gregory Pantano | 98,328 | 46.32 | +15.16 | |
| Majority | 15,629 | 7.36 | -30.33 | ||
| Total votes | 212,285 | 100.00 | -32.16 | ||
| Party | Candidate | Votes | % | ±% | |
|---|---|---|---|---|---|
| Democratic | Mike McIntyre (incumbent) | 168,695 | 50.10 | -3.58 | |
| Republican | David Rouzer | 168,041 | 49.90 | +3.58 | |
| Majority | 654 | 0.19 | -7.17 | ||
| Total votes | 336,736 | 100.00 | +58.62 | ||
| Party | Candidate | Votes | % | |
|---|---|---|---|---|
| Republican | David Rouzer | 134,431 | 59.35 | |
| Democratic | Jonathan Barfield Jr. | 84,054 | 37.11 | |
| Libertarian | J. Wesley Casteen | 7,850 | 3.47 | |
| N/A | Miscellaneous | 163 | 0.07 | |
| N/A | Louis Harmati | 6 | 0 | |
| Total votes | 226,504 | 100.00 | ||
| Party | Candidate | Votes | % | |
|---|---|---|---|---|
| Republican | David Rouzer (incumbent) | 211,801 | 60.91 | |
| Democratic | J. Wesley Casteen | 135,905 | 39.09 | |
| Total votes | 347,706 | 100.00 | ||
| Party | Candidate | Votes | % | |
|---|---|---|---|---|
| Republican | David Rouzer (incumbent) | 156,809 | 55.54 | |
| Democratic | Kyle Horton | 120,838 | 42.80 | |
| Constitution | David W. Fallin | 4,655 | 1.65 | |
| Total votes | 282,312 | 100.00 | ||
| Party | Candidate | Votes | % | |
|---|---|---|---|---|
| Republican | David Rouzer (incumbent) | 272,443 | 60.2 | |
| Democratic | Chris Ward | 179,045 | 39.6 | |
| Write-in | 720 | 0.2 | ||
| Total votes | 452,208 | 100.0 | ||
Historical district boundaries
2003 - 2013
.tif.png.webp)
2013–2017
References
- Martis, Kenneth C. (1989). The Historical Atlas of Political Parties in the United States Congress. New York: Macmillan Publishing Company.
- Martis, Kenneth C. (1982). The Historical Atlas of United States Congressional Districts. New York: Macmillan Publishing Company.
- Congressional Biographical Directory of the United States 1774–present
- "Congressional Districts Relationship Files (State-based)". U.S. Census Bureau. Archived from the original on April 2, 2013.
- Center for New Media & Promotion (CNMP), US Census Bureau. "My Congressional District". www.census.gov.
- "Introducing the 2021 Cook Political Report Partisan Voter Index". The Cook Political Report. April 15, 2021. Retrieved April 15, 2021.
- Doule, Steve (February 23, 2022). "Check out new election maps: NC Supreme Court rejects appeals, approves special masters' districts". WGHP. Retrieved March 21, 2022.
- "Data Courtesy of Jeffrey B. Lewis, Brandon DeVine, and Lincoln Pritcher with Kenneth C. Martis". United States Congressional District Shapefiles.
- "United States House of Representatives: Abstract of Votes Cast in the General Election held on November 5, 1996" (PDF). North Carolina State Board of Elections. Retrieved May 1, 2012.
- "US House - 07th" (PDF). North Carolina State Board of Elections. Retrieved May 1, 2012.
- "Official Results By County For General Election of the State of North Carolina" (PDF). North Carolina State Board of Elections. Retrieved May 1, 2012.
- "2002 General Election Results" (PDF). North Carolina State Board of Elections. Retrieved May 1, 2012.
- "2004 General Election Results" (PDF). North Carolina State Board of Elections. Retrieved May 1, 2012.
- "2006 General Election Results" (PDF). North Carolina State Board of Elections. Retrieved May 1, 2012.
- "NC - Election Results". North Carolina State Board of Elections. Retrieved May 1, 2012.
- "NC - Election Results". North Carolina State Board of Elections. Retrieved May 1, 2012.
- "NC State Board of Elections Official Results". North Carolina State Board of Elections. Retrieved October 9, 2013.
- "11/04/2014 Official General Election Results - Statewide". North Carolina State Board of Elections. December 13, 2016. Retrieved December 22, 2017.
- "11/08/2016 Official General Election Results - Statewide". North Carolina State Board of Elections. December 13, 2016. Retrieved December 22, 2017.
- "11/06/2018 Official General Election Results - Statewide". North Carolina State Board of Elections. November 27, 2018. Retrieved May 22, 2019.
External links
This article is issued from Wikipedia. The text is licensed under Creative Commons - Attribution - Sharealike. Additional terms may apply for the media files.