Miyoshi, Tokushima
Miyoshi (三好市, Miyoshi-shi) is a city located in Tokushima Prefecture, Japan. As of June 1, 2019, the city has an estimated population of 24,368 and a population density of 33.8 persons per km². The total area is 721.42 km².
Miyoshi
三好市 | |
|---|---|
| Miyoshi City | |
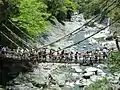
Kazura Bridge, a popular sightseeing spot in Miyoshi | |
|
Flag Emblem | |
Location of Miyoshi in Tokushima Prefecture | |
 Miyoshi Location in Japan | |
| Coordinates: 34°01′33.7″N 133°48′25.8″E | |
| Country | Japan |
| Region | Shikoku |
| Prefecture | Tokushima Prefecture |
| Government | |
| • Mayor | Seiichi Kurokawa (since July 2013) |
| Area | |
| • Total | 721.42 km2 (278.54 sq mi) |
| Population (June 1, 2019) | |
| • Total | 24,368 |
| • Density | 34/km2 (87/sq mi) |
| Time zone | UTC+09:00 (JST) |
| City hall address | Ikeda Shinmachi 1500-2, Miyoshi City, Tokushima Prefecture (徳島県三好市池田町シンマチ1500番地2) 778-8501 |
| Climate | Cfa |
| Website | https://www.miyoshi.i-tokushima.jp/ |
| Symbols | |
| Bird | Japanese white-eye |
| Flower | Habenaria radiata |
| Tree | Maple leaf |
The modern city of Miyoshi was established on March 1, 2006, from the merger between the towns of Ikeda, Ikawa, Mino and Yamashiro, and the villages of Higashiiyayama and Nishiiyayama (all from Miyoshi District).
The City of Miyoshi has a sister city relationship with The City of The Dalles in Oregon (USA).
Geography
Climate
Miyoshi has a humid subtropical climate (Köppen climate classification Cfa) with hot summers and cool winters. Precipitation is high, but there is a pronounced difference between the wetter summers and drier winters. The average annual temperature in Miyoshi is 14.3 °C (57.7 °F). The average annual rainfall is 1,497.5 mm (58.96 in) with September as the wettest month. The temperatures are highest on average in August, at around 25.6 °C (78.1 °F), and lowest in January, at around 3.5 °C (38.3 °F).[1] The highest temperature ever recorded in Miyoshi was 37.1 °C (98.8 °F) on 16 July 1994; the coldest temperature ever recorded was −11.5 °C (11.3 °F) on 28 February 1981.[2]
| Climate data for Ikeda, Miyoshi (1991−2020 normals, extremes 1978−present) | |||||||||||||
|---|---|---|---|---|---|---|---|---|---|---|---|---|---|
| Month | Jan | Feb | Mar | Apr | May | Jun | Jul | Aug | Sep | Oct | Nov | Dec | Year |
| Record high °C (°F) | 18.8 (65.8) |
21.9 (71.4) |
24.4 (75.9) |
30.9 (87.6) |
32.4 (90.3) |
33.8 (92.8) |
37.1 (98.8) |
37.0 (98.6) |
35.2 (95.4) |
30.7 (87.3) |
25.7 (78.3) |
23.1 (73.6) |
37.1 (98.8) |
| Average high °C (°F) | 8.0 (46.4) |
9.3 (48.7) |
13.3 (55.9) |
19.3 (66.7) |
24.1 (75.4) |
26.6 (79.9) |
30.5 (86.9) |
31.6 (88.9) |
27.3 (81.1) |
21.6 (70.9) |
15.9 (60.6) |
10.4 (50.7) |
19.8 (67.7) |
| Daily mean °C (°F) | 3.5 (38.3) |
4.2 (39.6) |
7.5 (45.5) |
13.0 (55.4) |
17.7 (63.9) |
21.2 (70.2) |
25.1 (77.2) |
25.6 (78.1) |
21.8 (71.2) |
16.0 (60.8) |
10.5 (50.9) |
5.6 (42.1) |
14.3 (57.8) |
| Average low °C (°F) | −0.3 (31.5) |
−0.3 (31.5) |
2.3 (36.1) |
7.1 (44.8) |
12.0 (53.6) |
16.9 (62.4) |
21.1 (70.0) |
21.5 (70.7) |
17.8 (64.0) |
11.8 (53.2) |
6.1 (43.0) |
1.7 (35.1) |
9.8 (49.7) |
| Record low °C (°F) | −6.0 (21.2) |
−7.9 (17.8) |
−5.1 (22.8) |
−2.4 (27.7) |
2.3 (36.1) |
8.2 (46.8) |
13.6 (56.5) |
14.6 (58.3) |
7.5 (45.5) |
1.3 (34.3) |
−1.4 (29.5) |
−5.1 (22.8) |
−7.9 (17.8) |
| Average precipitation mm (inches) | 56.5 (2.22) |
60.9 (2.40) |
94.5 (3.72) |
86.1 (3.39) |
124.6 (4.91) |
197.6 (7.78) |
211.5 (8.33) |
169.2 (6.66) |
222.1 (8.74) |
136.8 (5.39) |
78.6 (3.09) |
84.6 (3.33) |
1,497.5 (58.96) |
| Average precipitation days (≥ 1.0 mm) | 9.9 | 10.0 | 11.9 | 10.0 | 9.8 | 12.6 | 11.9 | 10.3 | 11.0 | 9.2 | 8.7 | 10.8 | 126.1 |
| Mean monthly sunshine hours | 102.5 | 113.9 | 157.3 | 188.1 | 198.9 | 138.5 | 177.5 | 200.3 | 144.3 | 151.8 | 124.5 | 101.6 | 1,799.4 |
| Source: Japan Meteorological Agency[2][1] | |||||||||||||
| Climate data for Higashiiyakyojo, Miyoshi (1991−2020 normals, extremes 1978−present) | |||||||||||||
|---|---|---|---|---|---|---|---|---|---|---|---|---|---|
| Month | Jan | Feb | Mar | Apr | May | Jun | Jul | Aug | Sep | Oct | Nov | Dec | Year |
| Record high °C (°F) | 17.9 (64.2) |
22.6 (72.7) |
23.7 (74.7) |
29.8 (85.6) |
31.6 (88.9) |
32.7 (90.9) |
35.7 (96.3) |
35.5 (95.9) |
33.4 (92.1) |
30.4 (86.7) |
24.2 (75.6) |
21.5 (70.7) |
35.7 (96.3) |
| Average high °C (°F) | 6.5 (43.7) |
8.0 (46.4) |
12.3 (54.1) |
18.1 (64.6) |
22.6 (72.7) |
25.1 (77.2) |
28.8 (83.8) |
29.6 (85.3) |
25.8 (78.4) |
20.5 (68.9) |
15.0 (59.0) |
9.0 (48.2) |
18.4 (65.2) |
| Daily mean °C (°F) | 1.4 (34.5) |
2.4 (36.3) |
5.9 (42.6) |
11.1 (52.0) |
15.6 (60.1) |
19.1 (66.4) |
22.8 (73.0) |
23.2 (73.8) |
19.8 (67.6) |
14.1 (57.4) |
8.6 (47.5) |
3.5 (38.3) |
12.3 (54.1) |
| Average low °C (°F) | −2.1 (28.2) |
−1.8 (28.8) |
0.8 (33.4) |
5.2 (41.4) |
9.7 (49.5) |
14.7 (58.5) |
18.7 (65.7) |
19.0 (66.2) |
15.7 (60.3) |
9.6 (49.3) |
4.0 (39.2) |
−0.3 (31.5) |
7.8 (46.0) |
| Record low °C (°F) | −10.6 (12.9) |
−11.5 (11.3) |
−7.7 (18.1) |
−3.8 (25.2) |
−0.6 (30.9) |
4.3 (39.7) |
9.1 (48.4) |
11.3 (52.3) |
5.4 (41.7) |
−0.3 (31.5) |
−2.9 (26.8) |
−8.7 (16.3) |
−11.5 (11.3) |
| Average precipitation mm (inches) | 81.2 (3.20) |
104.0 (4.09) |
142.9 (5.63) |
142.2 (5.60) |
177.9 (7.00) |
299.1 (11.78) |
414.1 (16.30) |
331.8 (13.06) |
356.0 (14.02) |
188.0 (7.40) |
103.3 (4.07) |
108.9 (4.29) |
2,437.3 (95.96) |
| Average precipitation days (≥ 1.0 mm) | 11.8 | 11.7 | 12.9 | 11.0 | 10.7 | 14.2 | 14.8 | 12.9 | 12.9 | 9.9 | 8.6 | 12.1 | 143.5 |
| Mean monthly sunshine hours | 94.3 | 109.1 | 151.4 | 188.8 | 199.6 | 141.8 | 166.2 | 174.7 | 136.4 | 149.6 | 118.9 | 98.3 | 1,732.3 |
| Source: Japan Meteorological Agency[3][4] | |||||||||||||
Demographics
Per Japanese census data, the population of Miyoshi in 2020 is 23,605 people.[5] Miyoshi has been conducting censuses since 1920.
| Year | Pop. | ±% |
|---|---|---|
| 1920 | 61,689 | — |
| 1925 | 64,904 | +5.2% |
| 1930 | 64,922 | +0.0% |
| 1935 | 65,486 | +0.9% |
| 1940 | 63,080 | −3.7% |
| 1945 | 76,457 | +21.2% |
| 1950 | 77,702 | +1.6% |
| 1955 | 77,779 | +0.1% |
| 1960 | 71,370 | −8.2% |
| 1965 | 63,837 | −10.6% |
| 1970 | 55,537 | −13.0% |
| 1975 | 50,121 | −9.8% |
| 1980 | 47,057 | −6.1% |
| 1985 | 45,340 | −3.6% |
| 1990 | 42,219 | −6.9% |
| 1995 | 40,087 | −5.0% |
| 2000 | 37,305 | −6.9% |
| 2005 | 34,103 | −8.6% |
| 2010 | 29,963 | −12.1% |
| 2015 | 26,836 | −10.4% |
| 2020 | 23,605 | −12.0% |
| Miyoshi population statistics[5] | ||
Tourism

References
- 気象庁 / 平年値(年・月ごとの値). JMA. Retrieved April 14, 2022.
- 観測史上1~10位の値(年間を通じての値). JMA. Retrieved April 14, 2022.
- 観測史上1~10位の値(年間を通じての値). JMA. Retrieved April 14, 2022.
- 気象庁 / 平年値(年・月ごとの値). JMA. Retrieved April 14, 2022.
- Miyoshi population statistics
External links
 Media related to Miyoshi, Tokushima at Wikimedia Commons
| Wikivoyage has a travel guide for Miyoshi (Tokushima). |
- Miyoshi City official website (in Japanese)
- miyoshi-tourism (in English)
| Cities | |
|---|---|
| Districts | |