Marshall County, Iowa
Marshall County is a county located in the U.S. state of Iowa. As of the 2020 census, the population was 40,105.[1] The county seat is Marshalltown.[2] The county was formed on January 13, 1846, and named after John Marshall, Chief Justice of the United States Supreme Court.[3]
Marshall County | |
|---|---|
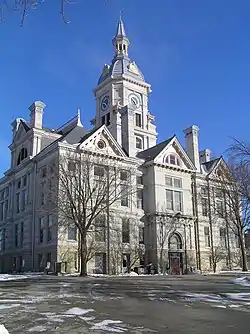 The courthouse in Marshalltown is on the NRHP | |
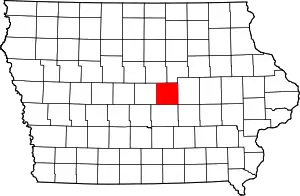 Location within the U.S. state of Iowa | |
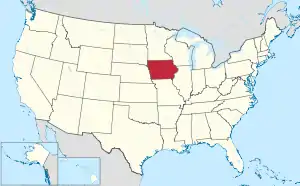 Iowa's location within the U.S. | |
| Coordinates: 42°02′03″N 93°00′04″W | |
| Country | |
| State | |
| Founded | 1846 |
| Named for | John Marshall |
| Seat | Marshalltown |
| Largest city | Marshalltown |
| Area | |
| • Total | 573 sq mi (1,480 km2) |
| • Land | 572 sq mi (1,480 km2) |
| • Water | 0.7 sq mi (2 km2) 0.1% |
| Population (2020) | |
| • Total | 40,105 |
| • Density | 70/sq mi (27/km2) |
| Time zone | UTC−6 (Central) |
| • Summer (DST) | UTC−5 (CDT) |
| Congressional district | 1st |
| Website | www |
Marshall County comprises the Marshalltown, IA Micropolitan Statistical Area.
In 2010, the center of population of Iowa was located in Marshall County, near Melbourne.[4]
In Chapter IX of MacKinlay Kantor's Pulitzer Prize-winning novel "Andersonville" (1955), a teenage boy travels to Marshall County to hand-deliver money to an ailing aunt.
Geography
According to the U.S. Census Bureau, the county has a total area of 573 square miles (1,480 km2), of which 573 square miles (1,480 km2) is land and 0.7 square miles (1.8 km2) (0.1%) is water.[5]
Adjacent counties
Jasper County (South)
Tama County (East)
Story County (West)
Hardin County (Northwest)
Grundy County (North)
Demographics
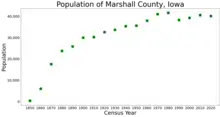
| Historical population | |||
|---|---|---|---|
| Census | Pop. | %± | |
| 1850 | 338 | — | |
| 1860 | 6,015 | 1,679.6% | |
| 1870 | 17,576 | 192.2% | |
| 1880 | 23,752 | 35.1% | |
| 1890 | 25,842 | 8.8% | |
| 1900 | 29,991 | 16.1% | |
| 1910 | 30,279 | 1.0% | |
| 1920 | 32,630 | 7.8% | |
| 1930 | 33,727 | 3.4% | |
| 1940 | 35,406 | 5.0% | |
| 1950 | 35,611 | 0.6% | |
| 1960 | 37,984 | 6.7% | |
| 1970 | 41,076 | 8.1% | |
| 1980 | 41,652 | 1.4% | |
| 1990 | 38,276 | −8.1% | |
| 2000 | 39,311 | 2.7% | |
| 2010 | 40,648 | 3.4% | |
| 2020 | 40,105 | −1.3% | |
| U.S. Decennial Census[6] 1790-1960[7] 1900-1990[8] 1990-2000[9] 2010-2018[10] | |||
2020 census
The 2020 census recorded a population of 40,105 in the county, with a population density of 70.1835/sq mi (27.0980/km2). 90.76% of the population reported being of one race. 50.96% were non-Hispanic White, 2.03% were Black, 22.79% were Hispanic, 0.82% were Native American, 3.78% were Asian, 0.08% were Native Hawaiian or Pacific Islander and 19.53% were some other race or more than one race. There were 16,745 housing units, of which 15,358 were occupied.[1]
2010 census
The 2010 census recorded a population of 40,648 in the county, with a population density of 71.0232/sq mi (27.4222/km2). There were 16,831 housing units, of which 15,538 were occupied.[11]
2000 census
At the 2000 census there were 39,311 people, 15,338 households, and 10,460 families in the county. The population density was 69 people per square mile (27/km2). There were 16,324 housing units at an average density of 28 per square mile (11/km2). The racial makeup of the county was 90.44% White, 0.93% Black or African American, 0.35% Native American, 0.78% Asian, 0.06% Pacific Islander, 6.03% from other races, and 1.42% from two or more races. 8.96%.[12] were Hispanic or Latino of any race.
Of the 15,338 households 31.10% had children under the age of 18 living with them, 55.40% were married couples living together, 9.30% had a female householder with no husband present, and 31.80% were non-families. 26.90% of households were one person and 12.20% were one person aged 65 or older. The average household size was 2.48 and the average family size was 3.00.
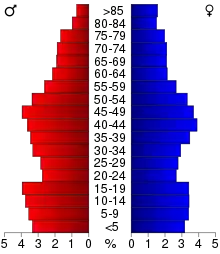
The age distribution was 25.30% under the age of 18, 8.10% from 18 to 24, 26.30% from 25 to 44, 23.90% from 45 to 64, and 16.40% 65 or older. The median age was 39 years. For every 100 females there were 99.20 males. For every 100 females age 18 and over, there were 96.50 males.
The median household income was $38,268 and the median family income was $46,627. Males had a median income of $33,809 versus $24,063 for females. The per capita income for the county was $19,176. About 7.10% of families and 10.20% of the population were below the poverty line, including 14.30% of those under age 18 and 8.60% of those age 65 or over.
Communities
Cities
- Albion
- Clemons
- Ferguson
- Gilman
- Haverhill
- Laurel
- Le Grand
- Liscomb
- Marshalltown
- Melbourne
- Rhodes (previously named Edenville)[13]
- St. Anthony
- State Center
Census-designated place
Townships
Population ranking
The population ranking of the following table is based on the 2020 census of Marshall County.[1]
† county seat
| Rank | City/Town/etc. | Municipal type | Population (2020 Census) |
|---|---|---|---|
| 1 | † Marshalltown | City | 27,591 |
| 2 | State Center | City | 1,391 |
| 3 | Le Grand (partially in Tama County) | City | 905 |
| 4 | Melbourne | City | 786 |
| 5 | Gilman | City | 542 |
| 6 | Albion | City | 448 |
| 7 | Liscomb | City | 291 |
| 8 | Rhodes | City | 271 |
| 9 | Laurel | City | 220 |
| 10 | Haverhill | City | 165 |
| 11 | Clemons | City | 140 |
| 12 | Green Mountain | CDP | 113 |
| 13 | Ferguson | City | 97 |
| 14 | St. Anthony | City | 76 |
Politics
Prior to 1964, Marshall County was strongly Republican, never backing a Democratic presidential candidate from 1880 to 1960 and only failing to back a Republican candidate during those years in 1912 with a strong third party campaign by former president Theodore Roosevelt on the Bull Moose ticket. Since then, it has become far more of a swing county, having backed the national winner in the seven presidential elections from 1992 to 2016. That streak was broken in 2020, when Donald Trump won the county with a higher percentage of votes than 2016. The county is considered a bellwether polity.[14]
| Year | Republican | Democratic | Third Parties |
|---|---|---|---|
| 2020 | 52.8% 9,571 | 45.1% 8,176 | 2.1% 389 |
| 2016 | 50.9% 9,146 | 42.6% 7,652 | 6.6% 1,182 |
| 2012 | 44.4% 8,472 | 53.8% 10,257 | 1.8% 335 |
| 2008 | 44.4% 8,278 | 53.7% 10,023 | 1.9% 362 |
| 2004 | 49.9% 9,557 | 49.3% 9,443 | 0.9% 164 |
| 2000 | 49.9% 8,785 | 47.2% 8,322 | 2.9% 517 |
| 1996 | 40.5% 7,017 | 50.0% 8,669 | 9.5% 1,638 |
| 1992 | 37.1% 6,784 | 45.4% 8,303 | 17.5% 3,202 |
| 1988 | 43.6% 7,657 | 55.6% 9,760 | 0.8% 132 |
| 1984 | 54.6% 10,839 | 44.4% 8,809 | 1.0% 192 |
| 1980 | 54.6% 10,707 | 36.3% 7,114 | 9.2% 1,805 |
| 1976 | 51.3% 9,562 | 46.7% 8,695 | 2.0% 373 |
| 1972 | 60.9% 10,798 | 37.3% 6,618 | 1.9% 328 |
| 1968 | 56.4% 9,402 | 38.1% 6,362 | 5.5% 922 |
| 1964 | 39.1% 6,323 | 60.7% 9,815 | 0.2% 38 |
| 1960 | 60.2% 10,265 | 39.7% 6,761 | 0.1% 16 |
| 1956 | 62.7% 10,305 | 35.0% 5,755 | 2.2% 365 |
| 1952 | 65.9% 11,135 | 31.5% 5,314 | 2.6% 441 |
| 1948 | 52.2% 6,698 | 43.7% 5,602 | 4.2% 533 |
| 1944 | 55.7% 7,325 | 42.6% 5,598 | 1.8% 234 |
| 1940 | 56.4% 8,503 | 43.1% 6,497 | 0.4% 65 |
| 1936 | 52.7% 7,377 | 45.0% 6,297 | 2.4% 334 |
| 1932 | 49.0% 6,604 | 47.4% 6,385 | 3.7% 494 |
| 1928 | 72.9% 9,326 | 26.5% 3,384 | 0.6% 82 |
| 1924 | 68.1% 9,010 | 11.5% 1,516 | 20.5% 2,707 |
| 1920 | 79.1% 9,334 | 18.4% 2,166 | 2.5% 300 |
| 1916 | 60.3% 4,172 | 34.9% 2,414 | 4.8% 330 |
| 1912 | 13.8% 926 | 32.2% 2,162 | 54.0% 3,629 |
| 1908 | 61.3% 3,887 | 30.6% 1,941 | 8.0% 509 |
| 1904 | 66.7% 4,229 | 19.0% 1,203 | 14.3% 905 |
| 1900 | 65.1% 4,878 | 31.1% 2,329 | 3.9% 289 |
| 1896 | 61.9% 4,541 | 35.8% 2,626 | 2.4% 175 |
See also
References
- "2020 Census State Redistricting Data". census.gov. United states Census Bureau. Retrieved August 12, 2021.
- "Find a County". National Association of Counties. Retrieved June 7, 2011.
- "Courthouse History—Marshall County, Iowa". Archived from the original on October 29, 2018. Retrieved January 20, 2008.
- "Centers of Population by State: 2010". United States Census Bureau. Retrieved July 20, 2014.
- "US Gazetteer files: 2010, 2000, and 1990". United States Census Bureau. February 12, 2011. Retrieved April 23, 2011.
- "U.S. Decennial Census". United States Census Bureau. Retrieved July 20, 2014.
- "Historical Census Browser". University of Virginia Library. Retrieved July 20, 2014.
- "Population of Counties by Decennial Census: 1900 to 1990". United States Census Bureau. Retrieved July 20, 2014.
- "Census 2000 PHC-T-4. Ranking Tables for Counties: 1990 and 2000" (PDF). United States Census Bureau. Retrieved July 20, 2014.
- "State & County QuickFacts". United States Census Bureau. Archived from the original on June 7, 2011. Retrieved July 20, 2014.
- "Population & Housing Occupancy Status 2010". United States Census Bureau American FactFinder. Retrieved May 23, 2011.
- "U.S. Census website". United States Census Bureau. Retrieved January 31, 2008.
- "RootsWeb.com Home Page". freepages.family.rootsweb.ancestry.com. Retrieved April 11, 2018.
- David Wasserman (October 6, 2020), "The 10 Bellwether Counties That Show How Trump Is in Serious Trouble", Nytimes.com
- Leip, David. "Dave Leip's Atlas of U.S. Presidential Elections". uselectionatlas.org. Retrieved February 22, 2021.
External links
| Wikimedia Commons has media related to Marshall County, Iowa. |
Places adjacent to Marshall County, Iowa | ||||||||||||||||
|---|---|---|---|---|---|---|---|---|---|---|---|---|---|---|---|---|
| ||||||||||||||||
Municipalities and communities of Marshall County, Iowa, United States | ||
|---|---|---|
| Cities | Map of Iowa highlighting Marshall County | |
| Townships | ||
| CDP | ||
| Other unincorporated communities | ||
| Footnotes | ‡This populated place also has portions in an adjacent county or counties | |
| ||