Ohio's 13th congressional district
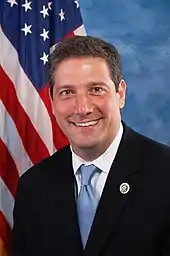
The 13th congressional district of Ohio is represented by Representative Tim Ryan. Due to reapportionment following the 2010 United States Census, Ohio lost its 17th and 18th congressional districts, necessitating redrawing of district lines. Following the 2012 elections, the 13th district changed to take in much of the territory in the former 17th district, including the city of Youngstown and areas east of Akron.
| Ohio's 13th congressional district | |||
|---|---|---|---|
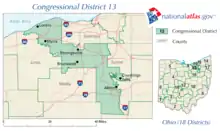
.tif.png.webp) Ohio's 13th congressional district since January 3, 2013 | |||
| Representative |
| ||
| Population (2019) | 704,191[1] | ||
| Median household income | $46,582[2] | ||
| Ethnicity |
| ||
| Cook PVI | D+1[3] | ||
It was one of several districts challenged in a 2018 lawsuit seeking to overturn Ohio's congressional map as an unconstitutional gerrymander.[4] According to the lawsuit, the 13th resembles a "jigsaw puzzle piece" that reaches out to grab the portion of Akron not taken in by the Cleveland-based 11th district.[5]
From 2003 to 2013, the district ran from Lorain to include part of Akron, also taking in the suburban areas in between.
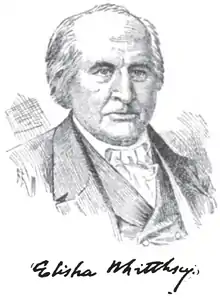
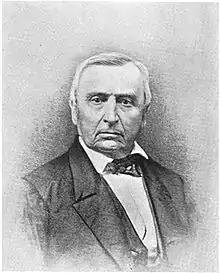
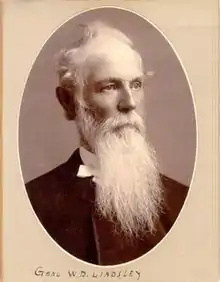
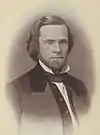
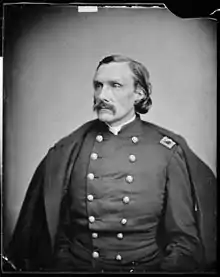
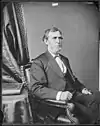
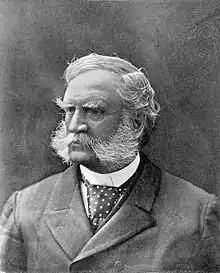
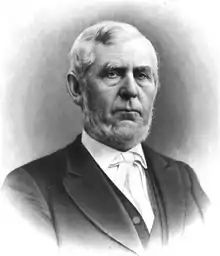
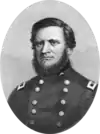
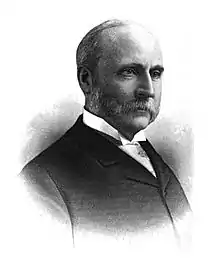
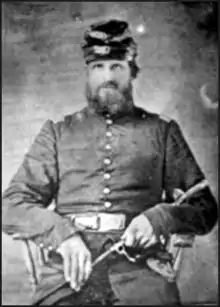
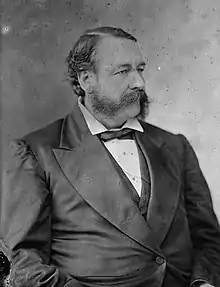
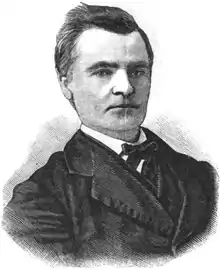
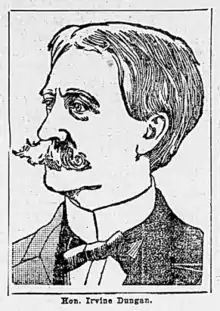
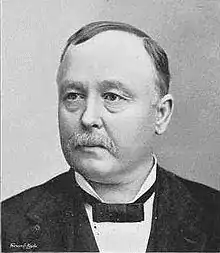
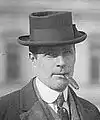
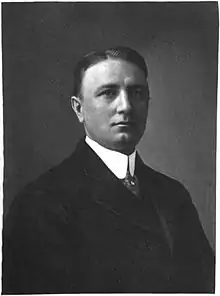
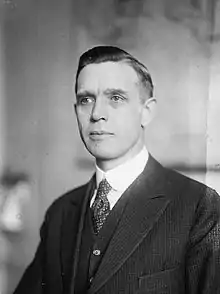
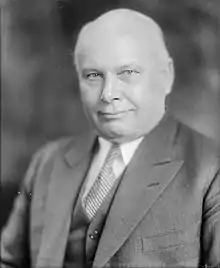
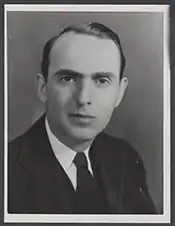
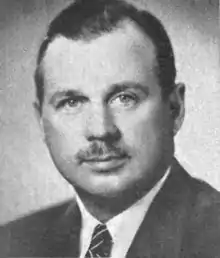
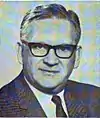
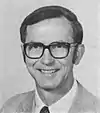
List of members representing the district
.jpg.webp)

.jpg.webp)


Recent election results
The following chart shows historic election results since 1920.
| Year | Democratic | Republican | Other |
|---|---|---|---|
| 1920 | Alfred Waggoner: 26,646 | ||
| 1922 | Arthur W. Overmyer: 30,199 | ||
| 1924 | John Dreitzler: 27,623 | ||
| 1926 | G. C. Steineman: 19,571 | ||
| 1928 | William C. Martin: 34,015 | ||
| 1930 | Joe E. Baird (Incumbent): 35,199 | ||
| 1932 | Walter E. Kruger: 39,122 | ||
| 1934 | Walter E. Kruger: 35,889 | Charles C. Few: 764 | |
| 1936 | Forrest R. Black: 39,042 | Merrell E. Martin: 12,959 | |
| 1938 | William L. Fiesinger: 24,749 | ||
| 1940 | Werner S. Haslinger: 40,274 | ||
| 1942 | E. C. Alexander: 23,618 | ||
| 1944 | |||
| 1946 | Frank W. Thomas: 19,237 | ||
| 1948 | Dwight A. Blackmore: 38,264 | ||
| 1950 | Dwight A. Blackmore: 24,042 | ||
| 1952 | George C. Steinemann: 44,467 | ||
| 1954 | George C. Steinemann: 32,177 | ||
| 1956 | J. P. Henderson: 32,900 | ||
| 1958 | J. William McCray: 45,390 | ||
| 1960 | J. William McCray: 69,033 | ||
| 1962 | J. Grant Keys: 52,030 | ||
| 1964 | Louis Frey: 62,780 | ||
| 1966 | Thomas E. Wolfe: 36,751 | ||
| 1968 | Adrian F. Betleski: 59,864 | ||
| 1970 | Joseph J. Bartolomeo: 53,271 | ||
| 1972 | John M. Ryan: 51,991 | ||
| 1974 | Fred M. Ritenauer: 53,766 | ||
| 1976 | Woodrow W. Mathna: 49,828 | Patricia A. Cortez: 5,794 | |
| 1978 | Mark W. Whitfield: 43,269 | ||
| 1980 | David Earl Armstrong: 64,296 | ||
| 1982 | Timothy Paul Martin: 53,376 | James S. Patton: 5,053 | |
| 1984 | William G. Schaffner: 59,610 | Other: 7,223 | |
| 1986 | William D. Nielsen Jr.: 52,452 | ||
| 1988 | Dwight Brown: 59,287 | ||
| 1990 | William D. Nielsen Jr.: 60,925 | John Michael Ryan: 10,506 | |
| 1992 | Margaret R. Mueller: 88,889 | Mark Miller: 20,320 Tom Lawson: 4,719 Werner J. Lange: 3,844 | |
| 1994 | Gregory A. White: 86,422 | Howard Mason: 7,777 John Michael Ryan: 2,430 | |
| 1996 | Kenneth C. Blair Jr.: 87,108 | David C. Kluter (N): 8,707 | |
| 1998 | Grace L. Drake: 72,666 | ||
| 2000 | Rick H. Jeric: 84,295 | Michael A. Chmura (L): 5,837 David C. Kluter (N): 3,108 | |
| 2002 | Ed Oliveros: 55,357 | ||
| 2004 | Robert Lucas: 95,025 | ||
| 2006 | Craig L. Foltin: 85,922 | ||
| 2008 | David Potter: 104,066 | Robert Crow: 37 | |
| 2010 | Tom Ganley: 94,367 | ||
| 2012[6] | Marisha Agana : 88,120 | ||
| 2014[7] | Thomas Pekarek: 55,233 | David Allen Pastorius (write-in): 86 | |
| 2016[8] | Richard A. Morckel: 99,377 | Calvin Hill Sr. (write-in): 17 | |
| 2018 | Chris DePizzo: 98,047 | ||
| 2020 | Christina Hagan: 148,648 | Michael Fricke: 8,522 |
Recent election results from statewide races
Under its current lines, the 13th district is usually strongly Democratic, although Republicans have carried it in statewide races.
| Year | Office | Results |
|---|---|---|
| 2000 | President | Al Gore 53 - George W. Bush 44% |
| 2004 | President | John Kerry 56 - George W. Bush 44% |
| 2008 | President | Barack Obama 62 - John McCain 36% |
| 2012 | President | Barack Obama 63 - Mitt Romney 36% |
| 2014 | Governor | John Kasich 53 - Ed FitzGerald 43% |
| 2016 | President | Hillary Clinton 51 - Donald Trump 45% |
| Senate | Rob Portman 48 - Ted Strickland 46% | |
| 2018 | Senate | Sherrod Brown 61 - Jim Renacci 36% |
| Governor | Richard Cordray 56 - Mike DeWine 40% | |
| 2020 | President | Joe Biden 51 - Donald Trump 47% |
Historical district boundaries
References
- "My Congressional District".
- "My Congressional District".
- "Introducing the 2021 Cook Political Report Partisan Voter Index". The Cook Political Report. April 15, 2021. Retrieved April 15, 2021.
- Todd Ruger, "Voters Challenge Ohio Congressional Map as Partisan Gerrymander", Roll Call, May 23, 2018. Retrieved 7 August 2018.
- Ohio A. Philip Randolph Institute et al., v. John Kasich, UNITED STATES DISTRICT COURT FOR THE SOUTHERN DISTRICT OF OHIO, filed 05/23/2018. Retrieved 7 August 2018.
- "2012 Election Results". Ohio Secretary of State.
- "2014 Election Results". Ohio Secretary of State.
- "2016 Election Results". Ohio Secretary of State.
- Martis, Kenneth C. (1989). The Historical Atlas of Political Parties in the United States Congress. New York: Macmillan Publishing Company.
- Martis, Kenneth C. (1982). The Historical Atlas of United States Congressional Districts. New York: Macmillan Publishing Company.
- Congressional Biographical Directory of the United States 1774–present