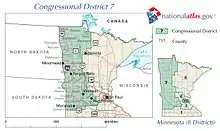
Minnesota's 7th congressional district
Minnesota's 7th congressional district covers the majority of western Minnesota. It is by far the state's largest district, and has a very rural character. Except for a few southern counties in 1st district, the 7th includes almost all of Western Minnesota. Cities in the district include Moorhead (its largest city), Fergus Falls, Alexandria and Willmar.
| Minnesota's 7th congressional district | |||
|---|---|---|---|
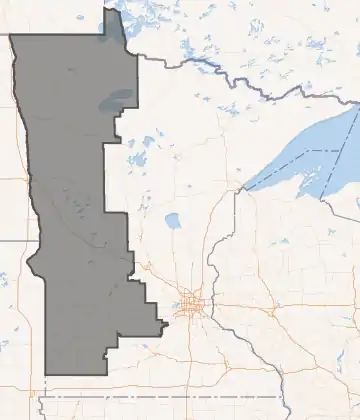
Interactive map of district boundaries | |||
| Representative |
| ||
| Area | 31,796[1] sq mi (82,350 km2) | ||
| Distribution |
| ||
| Population (2019) | 668,096[3] | ||
| Median household income | $60,932[4] | ||
| Ethnicity |
| ||
| Cook PVI | R+17[5] | ||
| External image | |
|---|---|
The 7th is the most Republican district in Minnesota, and is currently represented by Republican Michelle Fischbach. Despite this, the district was represented by DFL member Collin Peterson for 30 years (from 1991 to 2021), who was considered one of the most conservative Democrats in the House.
Demographics
According to the APM Research Lab's Voter Profile Tools[6] (featuring the U.S. Census Bureau's 2019 American Community Survey), the district contained about 501,000 potential voters (citizens, age 18+). Of these, 91% are White and 9% are people of color. Immigrants make up 2% of the district's potential voters. Median income among households (with one or more potential voter) in the district is about $61,000, while 9% of households live below the poverty line. As for the educational attainment of potential voters in the district, 8% of those 25 and older have not earned a high school degree, while 22% hold a bachelor's or higher degree.
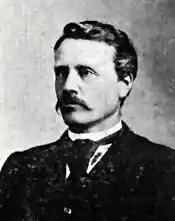
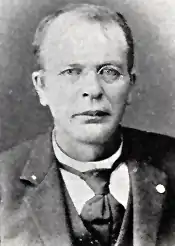
List of members representing the district


Recent elections
2002
| Party | Candidate | Votes | % | ±% | |
|---|---|---|---|---|---|
| Democratic (DFL) | Collin Peterson (incumbent) | 170,234 | 65.27 | - | |
| Republican | Dan Stevens | 90,342 | 34.64 | - | |
2004
| Party | Candidate | Votes | % | ±% | |
|---|---|---|---|---|---|
| Democratic (DFL) | Collin Peterson (incumbent) | 207,628 | 66.07 | +1 | |
| Republican | David Sturrock | 106,349 | 33.84 | - | |
2006
| Party | Candidate | Votes | % | ±% | |
|---|---|---|---|---|---|
| Democratic (DFL) | Collin Peterson (incumbent) | 179,164 | 70 | +4 | |
| Republican | Michael Barrett | 74,557 | 29 | - | |
| Constitution | Ken Lucier | 3,303 | 1 | - | |
2008
| Party | Candidate | Votes | % | ±% | |
|---|---|---|---|---|---|
| Democratic (DFL) | Collin Peterson (incumbent) | 227,180 | 72.20 | +2.2 | |
| Republican | Glen Menze | 87,062 | 27.67 | - | |
| N/A | others | 431 | 0.14 | - | |
2010
| Party | Candidate | Votes | % | ±% | |
|---|---|---|---|---|---|
| Democratic (DFL) | Collin Peterson (incumbent) | 159,479 | 52.5 | -19.7 | |
| Republican | Lee Byberg | 90,650 | 37.6 | +9.2 | |
| N/A | others | 17,155 | 7.2 | - | |
2012
| Party | Candidate | Votes | % | ±% | |
|---|---|---|---|---|---|
| Democratic (DFL) | Collin Peterson (incumbent) | 197,791 | 60.4 | +7.9 | |
| Republican | Lee Byberg | 114,151 | 34.8 | -2.8 | |
| N/A | others | 4.7 | - | ||
2014
| Party | Candidate | Votes | % | ±% | |
|---|---|---|---|---|---|
| Democratic (DFL) | Collin Peterson (incumbent) | 130,546 | 54.2 | -6.2 | |
| Republican | Torrey Westrom | 109,955 | 45.7 | +10.9 | |
| N/A | others | 334 | 0.1 | - | |
2016
| Party | Candidate | Votes | % | ±% | |
|---|---|---|---|---|---|
| Democratic (DFL) | Collin Peterson (incumbent) | 173,589 | 52.5 | -1.7 | |
| Republican | Dave Hughes | 156,952 | 47.4 | +1.7 | |
| N/A | others | 307 | 0.1 | - | |
2018
| Party | Candidate | Votes | % | ±% | |
|---|---|---|---|---|---|
| Democratic (DFL) | Collin Peterson (incumbent) | 146,672 | 52.1 | -0.4 | |
| Republican | Dave Hughes | 134,668 | 47.9 | +0.4 | |
| N/A | others | 168 | >0.1 | - | |
2020
| Party | Candidate | Votes | % | |
|---|---|---|---|---|
| Republican | Michelle Fischbach | 194,066 | 53.4 | |
| Democratic (DFL) | Collin Peterson (incumbent) | 144,840 | 39.8 | |
| Legal Marijuana Now | Slater Johnson | 17,710 | 4.9 | |
| Grassroots | Rae Hart Anderson | 6,499 | 1.8 | |
| Write-in | 362 | 0.1 | ||
Election results from presidential races
Election results from presidential races:
| Year | Office | Results | Political parties that won the district |
|---|---|---|---|
| 2000 | President | George W. Bush 54 - Al Gore 40% | Republican Party (United States) |
| 2004 | President | George W. Bush 55 - John Kerry 43% | Republican Party (United States) |
| 2008 | President | John McCain 50 - Barack Obama 47% | Republican Party (United States) |
| 2012 | President | Mitt Romney 54 - Barack Obama 44% | Republican Party (United States) |
| 2016 | President | Donald Trump 62 - Hillary Clinton 31% | Republican Party (United States) |
| 2020 | President | Donald Trump 63 - Joe Biden 34% | Republican Party (United States) |
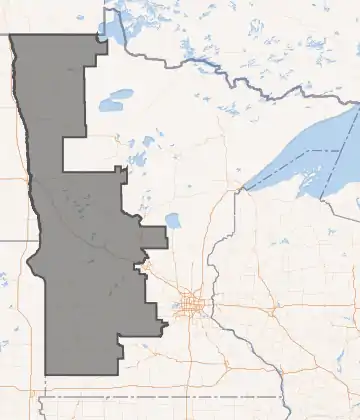
Historical district boundaries
References
- "Minnesota congressional districts by urban and rural population and land area" (PDF). US Census Bureau. 2000. Retrieved April 2, 2007.
- Geography, US Census Bureau. "Congressional Districts Relationship Files (state-based)". www.census.gov. Retrieved April 7, 2018.
- Bureau, Center for New Media & Promotion (CNMP), US Census. "My Congressional District". www.census.gov. Retrieved April 7, 2018.
- "My Congressional District".
- "Introducing the 2021 Cook Political Report Partisan Voter Index". The Cook Political Report. April 15, 2021. Retrieved April 15, 2021.
- "Representing US: 2020 Voter Profiles". APM Research Lab. Retrieved October 22, 2020.