List of U.S. states and territories by population
The states and territories included in the United States Census Bureau's statistics for the United States (population, ethnicity, religion, and most other categories) include the 50 states and the District of Columbia (Washington, D.C.). Separate statistics are maintained for the five permanently inhabited territories of the United States (Puerto Rico, Guam, the U.S. Virgin Islands, American Samoa, and the Northern Mariana Islands).[1]
Method
The United States Census counts the persons residing in the United States including citizens, non-citizen permanent residents and non-citizen long-term visitors.[2] Civilian and military federal employees serving abroad and their dependents are counted in their home state.[3]
Electoral apportionment
House of Representatives
Based on the decennial census, each state is allocated a portion of the 435 fixed seats in the United States House of Representatives, with each state guaranteed at least one. The allocation is based on each state's proportion of the combined population of the fifty states (not including the District of Columbia, Guam, American Samoa, the Northern Mariana Islands, Puerto Rico, or the United States Virgin Islands).
Electoral College
The Electoral College, every four years, elects the President and Vice President of the United States based on the popular vote in each state and the District of Columbia. Each state's number of votes in the Electoral College is equal to its number of members in the Senate plus members in the House of Representatives.[4]
The Twenty-third Amendment to the United States Constitution additionally grants the District of Columbia (D.C.), which is not part of any state, as many Electoral College votes as it would have if it were a state, while having no more votes than the least populous state (currently, Wyoming). Since the U.S. Constitution guarantees every state at least one member of the U.S. House of Representatives and two members of the U.S. Senate, every state has at least three Electoral College votes. Thus, the Electoral College has 538 members (100 senators, plus 435 representatives, plus 3 members for the District of Columbia).[4] Territories of the United States such as Puerto Rico are not included in the Electoral College: people in those territories cannot vote directly for the President of the United States,[5] although they may participate in the partisan nominating primaries and caucuses.[6]
State and territory rankings
Column header abbreviations:
- Abs. = Absolute, S. = Seats, elec. = electoral, Ch. = Change, Elec. Coll. = Electoral College
| Rank | State or territory | Census population [7][lower-alpha 1] |
Change, [7][lower-alpha 1]2010–2020 |
Pop. per elec. vote, 2020[lower-alpha 3] |
Census pop. per seat |
% of the total U.S. pop.[lower-alpha 4] |
% of Elec. Coll. | ||||||||
|---|---|---|---|---|---|---|---|---|---|---|---|---|---|---|---|
| 2021 | 2010 | July 1, 2021 |
April 1, 2010 |
% |
Abs. | S. | % | 2020 | 2010 | Est. 2020 | 2010 | Ch. 2010–2020 | |||
| 1 | 1 | 39,237,836 | 37,253,956 | 5.3% | 1,983,880 | 52 | 11.95% | 715,783 | 761,091 | 702,905 | 11.80% | 11.91% | –0.11% | 10.04% | |
| 2 | 2 | 29,527,941 | 25,145,561 | 17.4% | 4,382,380 | 38 | 8.74% | 772,652 | 767,981 | 698,488 | 8.70% | 8.04% | 0.66% | 7.43% | |
| 3 | 4 | 21,781,128 | 18,801,310 | 15.85% | 2,979,818 | 28 | 6.44% | 749,425 | 770,376 | 696,345 | 6.43% | 6.01% | 0.42% | 5.58% | |
| 4 | 3 | 19,835,913 | 19,378,102 | 2.36% | 457,811 | 26 | 5.98% | 666,785 | 777,529 | 717,707 | 6.03% | 6.19% | –0.17% | 5.20% | |
| 5 | 6 | 12,964,056 | 12,702,379 | 2.06% | 261,677 | 17 | 3.91% | 639,163 | 765,403 | 705,688 | 3.88% | 4.06% | –0.18% | 3.53% | |
| 6 | 5 | 12,671,469 | 12,830,632 | –0.1% | –18,124 | 17 | 3.91% | 629,377 | 754,279 | 712,813 | 3.82% | 4.10% | –0.28% | 3.53% | |
| 7 | 7 | 11,780,017 | 11,536,504 | 2.3% | 262,944 | 15 | 3.45% | 649,623 | 787,257 | 721,032 | 3.52% | 3.69% | –0.17% | 3.16% | |
| 8 | 9 | 10,799,566 | 9,687,653 | 10.6% | 1,024,255 | 14 | 3.22% | 669,376 | 766,091 | 691,975 | 3.20% | 3.10% | 0.10% | 2.97% | |
| 9 | 10 | 10,551,162 | 9,535,483 | 9.5% | 903,905 | 14 | 3.22% | 706,722 | 746,711 | 733,499 | 3.12% | 3.05% | 0.07% | 2.97% | |
| 10 | 8 | 10,050,811 | 9,883,640 | 2.0% | 193,691 | 13 | 2.99% | 622,910 | 775,726 | 705,974 | 3.01% | 3.16% | –0.15% | 2.79% | |
| 11 | 11 | 9,267,130 | 8,791,894 | 5.7% | 497,100 | 12 | 2.76% | 634,455 | 774,541 | 732,658 | 2.77% | 2.81% | –0.04% | 2.60% | |
| 12 | 12 | 8,642,274 | 8,001,024 | 7.9% | 630,369 | 11 | 2.53% | 660,813 | 786,777 | 727,366 | 2.58% | 2.56% | 0.02% | 2.42% | |
| 13 | 13 | 7,738,692 | 6,724,540 | 14.6% | 980,741 | 10 | 2.30% | 641,134 | 771,595 | 672,454 | 2.30% | 2.15% | 0.15% | 2.23% | |
| 14 | 16 | 7,276,316 | 6,392,017 | 11.9% | 759,485 | 9 | 2.07% | 674,673 | 795,436 | 710,224 | 2.13% | 2.04% | 0.09% | 2.04% | |
| 15 | 14 | 6,984,723 | 6,547,629 | 7.4% | 482,288 | 9 | 2.07% | 626,689 | 781,497 | 727,514 | 2.10% | 2.09% | 0.00% | 2.04% | |
| 16 | 17 | 6,975,218 | 6,346,105 | 8.9% | 564,735 | 9 | 2.07% | 626,076 | 768,544 | 705,123 | 2.06% | 2.03% | 0.03% | 2.04% | |
| 17 | 15 | 6,805,985 | 6,483,802 | 4.7% | 301,726 | 9 | 2.07% | 614,087 | 754,476 | 720,422 | 2.02% | 2.07% | –0.05% | 2.04% | |
| 18 | 19 | 6,165,129 | 5,773,552 | 7.0% | 403,672 | 8 | 1.84% | 615,155 | 773,160 | 748,616 | 1.84% | 1.85% | –0.00% | 1.86% | |
| 19 | 18 | 6,168,187 | 5,988,927 | 2.8% | 165,986 | 8 | 1.84% | 605,580 | 770,035 | 721,694 | 1.84% | 1.91% | –0.08% | 1.86% | |
| 20 | 20 | 5,895,908 | 5,686,986 | 3.6% | 206,732 | 8 | 1.84% | 583,266 | 737,184 | 710,873 | 1.76% | 1.82% | –0.06% | 1.86% | |
| 21 | 22 | 5,812,069 | 5,029,196 | 14.8% | 744,518 | 8 | 1.84% | 645,302 | 722,771 | 718,457 | 1.72% | 1.61% | 0.12% | 1.86% | |
| 22 | 21 | 5,707,390 | 5,303,925 | 7.6% | 402,569 | 8 | 1.84% | 565,734 | 713,719 | 662,991 | 1.70% | 1.70% | 0.01% | 1.86% | |
| 23 | 24 | 5,190,705 | 4,625,364 | 10.7% | 493,061 | 7 | 1.61% | 579,782 | 732,102 | 660,766 | 1.53% | 1.48% | 0.05% | 1.67% | |
| 24 | 23 | 5,039,877 | 4,779,736 | 5.1% | 244,543 | 7 | 1.61% | 546,837 | 718,579 | 682,819 | 1.50% | 1.53% | –0.03% | 1.67% | |
| 25 | 25 | 4,657,757 | 4,533,372 | 2.7% | 124,385 | 6 | 1.38% | 580,665 | 776,911 | 755,562 | 1.39% | 1.45% | –0.06% | 1.49% | |
| 26 | 26 | 4,505,836 | 4,339,367 | 3.8% | 166,469 | 6 | 1.38% | 559,656 | 751,557 | 723,228 | 1.35% | 1.39% | –0.04% | 1.49% | |
| 27 | 27 | 4,237,256 | 3,831,074 | 10.6% | 406,182 | 6 | 1.38% | 605,930 | 706,917 | 766,215 | 1.26% | 1.22% | 0.04% | 1.49% | |
| 28 | 28 | 3,959,353 | 3,751,351 | 5.5% | 208,002 | 5 | 1.15% | 568,683 | 792,703 | 750,270 | 1.18% | 1.20% | –0.02% | 1.30% | |
| 29 | 30 | 3,605,944 | 3,574,097 | 0.9% | 31,847 | 5 | 1.15% | 508,144 | 721,660 | 714,819 | 1.08% | 1.14% | –0.07% | 1.30% | |
| 30 | 29 | 3,285,874 | 3,725,789 | –11.8% | –439,915 | 1* | — | — | — | — | 0.98% | 1.19% | –0.21% | — | |
| 31 | 35 | 3,271,616 | 2,763,885 | 18.4% | 507,731 | 4 | 0.92% | 541,647 | 818,813 | 690,971 | 0.98% | 0.88% | 0.09% | 1.12% | |
| 32 | 31 | 3,190,369 | 3,046,355 | 4.7% | 144,014 | 4 | 0.92% | 527,260 | 798,102 | 761,589 | 0.95% | 0.97% | –0.02% | 1.12% | |
| 33 | 36 | 3,104,614 | 2,700,551 | 15.0% | 404,063 | 4 | 0.92% | 523,043 | 777,116 | 675,138 | 0.93% | 0.86% | 0.06% | 1.12% | |
| 34 | 33 | 3,011,524 | 2,915,918 | 3.3% | 95,606 | 4 | 0.92% | 505,087 | 753,439 | 728,980 | 0.90% | 0.93% | –0.03% | 1.12% | |
| 35 | 32 | 2,961,279 | 2,967,297 | –0.2% | –6,018 | 4 | 0.92% | 494,464 | 740,979 | 741,824 | 0.88% | 0.95% | –0.06% | 1.12% | |
| 36 | 34 | 2,937,880 | 2,853,118 | 3.0% | 84,762 | 4 | 0.92% | 485,634 | 735,216 | 713,280 | 0.88% | 0.91% | –0.04% | 1.12% | |
| 37 | 37 | 2,117,522 | 2,059,179 | 2.8% | 58,343 | 3 | 0.69% | 421,264 | 706,740 | 686,393 | 0.63% | 0.66% | –0.03% | 0.93% | |
| 38 | 39 | 1,961,504 | 1,826,341 | 7.4% | 135,163 | 3 | 0.69% | 387,510 | 654,444 | 608,780 | 0.59% | 0.58% | 0.00% | 0.93% | |
| 39 | 40 | 1,839,106 | 1,567,582 | 17.3% | 271,524 | 2 | 0.46% | 456,728 | 920,689 | 783,791 | 0.55% | 0.50% | 0.05% | 0.74% | |
| 40 | 38 | 1,793,716 | 1,852,994 | –3.2% | –59,278 | 2 | 0.46% | 356,957 | 897,523 | 617,665 | 0.54% | 0.59% | –0.06% | 0.74% | |
| 41 | 41 | 1,455,271 | 1,360,301 | 7.0% | 94,970 | 2 | 0.46% | 351,752 | 730,069 | 680,151 | 0.44% | 0.43% | 0.00% | 0.74% | |
| 42 | 43 | 1,377,529 | 1,316,470 | 4.6% | 61,059 | 2 | 0.46% | 341,569 | 689,545 | 658,235 | 0.41% | 0.42% | –0.01% | 0.74% | |
| 43 | 42 | 1,362,359 | 1,328,361 | 2.6% | 33,998 | 2 | 0.46% | 337,535 | 681,791 | 664,181 | 0.41% | 0.42% | –0.02% | 0.74% | |
| 44 | 44 | 1,097,379 | 1,052,567 | 4.3% | 44,812 | 2 | 0.46% | 264,281 | 549,082 | 526,284 | 0.33% | 0.34% | –0.01% | 0.74% | |
| 45 | 45 | 1,084,225 | 989,415 | 9.6% | 94,810 | 2 | 0.46% | 360,192 | 542,704 | 989,415 | 0.32% | 0.32% | 0.01% | 0.74% | |
| 46 | 46 | 989,948 | 897,934 | 10.2% | 92,014 | 1 | 0.23% | 328,936 | 990,837 | 897,934 | 0.30% | 0.29% | 0.01% | 0.56% | |
| 47 | 47 | 886,667 | 814,180 | 8.9% | 72,487 | 1 | 0.23% | 297,572 | 887,770 | 814,180 | 0.26% | 0.26% | 0.00% | 0.56% | |
| 48 | 49 | 779,094 | 672,591 | 15.8% | 106,503 | 1 | 0.23% | 255,103 | 779,702 | 672,591 | 0.23% | 0.21% | 0.02% | 0.56% | |
| 49 | 48 | 733,391 | 710,231 | 3.3% | 23,160 | 1 | 0.23% | 243,719 | 736,081 | 710,231 | 0.22% | 0.23% | –0.01% | 0.56% | |
| 50 | 51 | 689,545 | 601,723 | 14.6% | 87,822 | 1* | — | 237,605 | — | — | 0.21% | 0.19% | 0.01% | 0.56% | |
| 51 | 50 | 643,077 | 625,741 | 2.8% | 17,336 | 1 | 0.23% | 207,782 | 643,503 | 625,741 | 0.19% | 0.20% | –0.01% | 0.56% | |
| 52 | 52 | 576,851 | 563,626 | 2.3% | 13,225 | 1 | 0.23% | 194,109 | 577,719 | 563,626 | 0.17% | 0.18% | –0.01% | 0.56% | |
| 53 | 53 | 153,836 | 159,358 | –3.5% | –5,522 | 1* | — | — | — | — | 0.05% | 0.05% | –0.00% | — | |
| 54 | 54 | 87,146 | 106,405 | –18.1% | –19,259 | 1* | — | — | — | — | 0.03% | 0.03% | –0.00% | — | |
| 55 | 55 | 49,710 | 55,519 | –10.5% | –5,809 | 1* | — | — | — | — | 0.01% | 0.02% | –0.00% | — | |
| 56 | 56 | 47,329 | 53,883 | –12.2% | –6,554 | 1* | — | — | — | — | 0.01% | 0.02% | –0.00% | — | |
| — | — | Contiguous United States | 329,260,619 | 306,675,006 | 7.4% | +22,585,613 | 432 (+1*) |
99.31% | 616,471 | 757,745 | 709,896 | 98.27% | 98.03% | 0.24% | 98.70% |
| — | — | The 50 states | 330,759,736 | 308,143,815 | 7.3% | +22,615,921 | 435 | 100% | 614,526 | 755,796 | 708,377 | 98.71% | 98.50% | 0.22% | 99.44% |
| — | — | The 50 states and D.C. | 331,449,281 | 308,745,538 | 7.4% | +22,703,743 | 435 (+1*) |
100% | 612,424 | — | — | 98.92% | 98.69% | 0.23% | 100% |
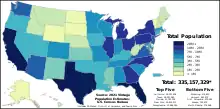
| — | — | Total United States | 335,073,176 | 312,846,492 | 7.1% | +22,226,684 | 435 (+6*) |
100% | — | — | — | 100% | 100% | — | — |
* — non-voting member of the House of Representatives.
- Resident population only; does not include overseas population
- Based on the 2020 census, which applies to congressional representation from 2023 to 2033. Percentages are based on voting members only.
- Each state has a number of votes in the Electoral College equal to its number of senators (two) and representatives in the Congress, while D.C. is granted 3 electoral votes. The Electoral College is used to elect the President and Vice President of the United States.
- Because of rounding of the individual percentages, the entries in this column may not sum to 100%.
Summary of population by region
| Legend |
|---|
| Division totals – 9 divisions for 50 states and District of Columbia |
| Region totals – 4 regions (2 or 3 divisions each) |
| Individual territories |
| Total U.S. territories |
| 50 states + District of Columbia |
| Divisions & regions as defined by U.S. Census Bureau |
| Last col. shows larger region which contains entity in col. 1 |
Column header abbreviations: # = Rank, Geo. = Geographic
| State/federal district/territory/ division/region |
# | 2020 pop. | # | 2010 pop. | # | 2000 pop. | # | 2010– 2020 change |
Geo. sort |
|---|---|---|---|---|---|---|---|---|---|
| 15 | 7,029,917 | 14 | 6,547,629 | 13 | 6,349,097 | 21 | 7.4% | NEng | |
| 29 | 3,605,944 | 29 | 3,574,097 | 29 | 3,405,565 | 47 | 0.9% | NEng | |
| 41 | 1,377,529 | 42 | 1,316,470 | 41 | 1,235,786 | 30 | 4.6% | NEng | |
| 42 | 1,362,359 | 41 | 1,328,361 | 40 | 1,274,923 | 42 | 2.6% | NEng | |
| 43 | 1,097,379 | 43 | 1,052,567 | 43 | 1,048,319 | 31 | 4.3% | NEng | |
| 49 | 643,077 | 49 | 625,741 | 49 | 608,827 | 40 | 2.8% | NEng | |
| New England | 9 | 15,116,205 | 9 | 14,444,865 | 9 | 13,922,517 | 7 | 4.6% | NEast |
| 4 | 20,201,249 | 3 | 19,378,102 | 3 | 18,976,457 | 32 | 4.2% | MAtl | |
| 5 | 13,002,700 | 6 | 12,702,379 | 6 | 12,281,054 | 43 | 2.4% | MAtl | |
| 11 | 9,288,994 | 11 | 8,791,894 | 9 | 8,414,350 | 25 | 5.7% | MAtl | |
| Mid-Atlantic | 4 | 42,492,943 | 4 | 40,872,375 | 4 | 39,671,861 | 8 | 4.0% | NEast |
| Northeast | 4 | 57,609,148 | 4 | 55,317,240 | 4 | 53,594,378 | 3 | 4.1% | USA |
| 3 | 21,538,187 | 4 | 18,801,310 | 4 | 15,982,378 | 8 | 14.6% | SAtl | |
| 8 | 10,711,908 | 9 | 9,687,653 | 10 | 8,186,453 | 12 | 10.6% | SAtl | |
| 9 | 10,439,388 | 10 | 9,535,483 | 11 | 8,049,313 | 15 | 9.5% | SAtl | |
| 12 | 8,631,393 | 12 | 8,001,024 | 12 | 7,078,515 | 18 | 7.9% | SAtl | |
| 18 | 6,177,224 | 19 | 5,773,552 | 19 | 5,296,486 | 22 | 7.0% | SAtl | |
| 23 | 5,118,425 | 24 | 4,625,364 | 26 | 4,012,012 | 10 | 10.7% | SAtl | |
| 39 | 1,793,716 | 37 | 1,852,994 | 37 | 1,808,344 | 50 | −3.2% | SAtl | |
| 45 | 989,948 | 45 | 897,934 | 45 | 783,600 | 13 | 10.2% | SAtl | |
| – | 689,545 | – | 601,723 | – | 572,059 | – | 14.6% | SAtl | |
| South Atlantic | 1 | 66,089,734 | 1 | 59,777,037 | 1 | 51,769,160 | 3 | 10.6% | South |
| 16 | 6,910,840 | 17 | 6,346,105 | 16 | 5,689,283 | 17 | 8.9% | ESC | |
| 24 | 5,024,279 | 23 | 4,779,736 | 23 | 4,447,100 | 27 | 5.1% | ESC | |
| 26 | 4,505,836 | 26 | 4,339,367 | 25 | 4,041,769 | 33 | 3.8% | ESC | |
| 34 | 2,961,279 | 31 | 2,967,297 | 31 | 2,844,658 | 49 | −0.2% | ESC | |
| East South Central | 8 | 19,402,234 | 8 | 18,432,505 | 8 | 17,022,810 | 6 | 5.3% | South |
| 2 | 29,145,505 | 2 | 25,145,561 | 2 | 20,851,820 | 3 | 15.9% | WSC | |
| 25 | 4,657,757 | 25 | 4,533,372 | 22 | 4,468,976 | 41 | 2.7% | WSC | |
| 28 | 3,959,353 | 28 | 3,751,351 | 27 | 3,450,654 | 26 | 5.5% | WSC | |
| 33 | 3,011,524 | 32 | 2,915,918 | 33 | 2,673,400 | 35 | 3.3% | WSC | |
| West South Central | 5 | 40,774,139 | 5 | 36,346,202 | 5 | 31,444,850 | 2 | 12.2% | South |
| South | 1 | 126,266,107 | 1 | 114,555,744 | 1 | 100,236,820 | 1 | 10.2% | USA |
| 6 | 12,812,508 | 5 | 12,830,632 | 5 | 12,419,293 | 48 | −0.1% | ENC | |
| 7 | 11,799,448 | 7 | 11,536,504 | 7 | 11,353,140 | 45 | 2.3% | ENC | |
| 10 | 10,077,331 | 8 | 9,883,640 | 8 | 9,938,444 | 46 | 2.0% | ENC | |
| 17 | 6,785,528 | 15 | 6,483,802 | 14 | 6,080,485 | 29 | 4.7% | ENC | |
| 20 | 5,893,718 | 20 | 5,686,986 | 18 | 5,363,675 | 34 | 3.6% | ENC | |
| East North Central | 3 | 47,368,533 | 3 | 46,421,564 | 2 | 45,155,037 | 9 | 2.0% | MWest |
| 19 | 6,154,913 | 18 | 5,988,927 | 17 | 5,595,211 | 39 | 2.8% | WNC | |
| 22 | 5,706,494 | 21 | 5,303,925 | 21 | 4,919,479 | 19 | 7.6% | WNC | |
| 31 | 3,190,369 | 30 | 3,046,355 | 30 | 2,926,324 | 28 | 4.7% | WNC | |
| 35 | 2,937,880 | 33 | 2,853,118 | 32 | 2,688,418 | 37 | 3.0% | WNC | |
| 37 | 1,961,504 | 38 | 1,826,341 | 38 | 1,711,263 | 20 | 7.4% | WNC | |
| 46 | 886,667 | 46 | 814,180 | 46 | 754,844 | 16 | 8.9% | WNC | |
| 47 | 779,094 | 48 | 672,591 | 47 | 642,200 | 4 | 15.8% | WNC | |
| West North Central | 7 | 21,616,921 | 7 | 20,505,437 | 6 | 19,237,739 | 5 | 5.4% | MWest |
| Midwest | 3 | 68,985,454 | 3 | 66,927,001 | 2 | 64,392,776 | 4 | 3.1% | USA |
| 14 | 7,151,502 | 16 | 6,392,017 | 20 | 5,130,632 | 9 | 11.9% | Mtn | |
| 21 | 5,773,714 | 22 | 5,029,196 | 24 | 4,301,261 | 6 | 14.8% | Mtn | |
| 30 | 3,271,616 | 34 | 2,763,885 | 34 | 2,233,169 | 1 | 18.4% | Mtn | |
| 32 | 3,104,614 | 35 | 2,700,551 | 35 | 1,998,257 | 5 | 15.0% | Mtn | |
| 36 | 2,117,522 | 36 | 2,059,179 | 36 | 1,819,046 | 38 | 2.8% | Mtn | |
| 38 | 1,839,106 | 39 | 1,567,582 | 39 | 1,293,953 | 2 | 17.3% | Mtn | |
| 44 | 1,084,225 | 44 | 989,415 | 44 | 902,195 | 14 | 9.6% | Mtn | |
| 50 | 576,851 | 50 | 563,626 | 50 | 493,782 | 44 | 2.3% | Mtn | |
| Mountain | 6 | 24,919,150 | 6 | 22,065,451 | 7 | 18,172,295 | 1 | 12.9% | West |
| 1 | 39,538,223 | 1 | 37,253,956 | 1 | 33,871,648 | 24 | 6.1% | Pac | |
| 13 | 7,705,281 | 13 | 6,724,540 | 15 | 5,894,121 | 7 | 14.6% | Pac | |
| 27 | 4,237,256 | 27 | 3,831,074 | 28 | 3,421,399 | 11 | 10.6% | Pac | |
| 40 | 1,455,271 | 40 | 1,360,301 | 42 | 1,211,537 | 23 | 7.0% | Pac | |
| 48 | 733,391 | 47 | 710,231 | 48 | 626,932 | 36 | 3.3% | Pac | |
| Pacific | 2 | 53,669,422 | 2 | 49,880,102 | 3 | 45,025,637 | 4 | 7.6% | West |
| West | 2 | 78,588,572 | 2 | 71,945,553 | 3 | 63,197,932 | 2 | 9.2% | USA |
| – | 331,449,281 | – | 308,745,538 | – | 281,421,906 | – | 7.4% | NAmer | |
| 1 | 3,285,874 | 1 | 3,725,789 | 1 | 3,808,610 | 3 | −11.8% | I.A. | |
| 2 | 153,836 | 2 | 159,358 | 2 | 154,805 | 1 | −3.5% | I.A. | |
| 3 | 87,146 | 3 | 106,405 | 3 | 108,612 | 2 | −18.1% | I.A. | |
| 4 | 49,710 | 4 | 55,519 | 5 | 57,291 | 4 | −7.7% | I.A. | |
| 5 | 47,329 | 5 | 53,883 | 4 | 69,221 | 5 | −14.8% | I.A. | |
| Island Areas (Territories)[note 1] | – | 3,623,895 | – | 4,100,954 | – | 4,198,539 | – | −11.6% | USA |
| State/federal district/territory/ division/region |
# | 2020 pop. | # | 2010 pop. | # | 2000 pop. | # | 2010– 2020 change |
Geo. sort |
See also
- Demographics of the United States
- List of U.S. states and territories by area
- List of U.S. states and territories by net migration
- List of U.S. states by African-American population
- List of U.S. states by historical population (tables of state populations since 1790)
- List of U.S. states by population density
- List of U.S. states by religiosity
- List of U.S. states by vehicles per capita
- List of U.S. states ranked per five-factor model personality trait
- List of United States cities by population
Notes
- The Census Bureau groups these five U.S. territories along with the mostly uninhabited (and, since 2010, not enumerated) U.S. Minor Outlying Islands into the "Island Areas" region.
References
- General
- "National Totals: Vintage 2015". United States Census Bureau. Archived from the original on December 23, 2015. Retrieved December 24, 2015.
- "2010Census Tables". U. S. Census Bureau. Retrieved November 6, 2020.
- "Congressional Apportionment: 2010 Census Brief". U. S. Census Bureau. November 2011. Retrieved November 6, 2020.
- "2009 Census estimates". U. S. Census Bureau. Archived from the original on August 7, 2010. Retrieved August 13, 2010.
- Statistical Abstract of the United States, 1995, U.S. Census Bureau, Section 29: Outlying Areas, Table No. 1347. Land Area and Population Characteristics, by [Outlying] Area: 1990 (page 828). Retrieved May 28, 2011
- Specific
- Geographic Terms and Concepts - Island Areas of the United States, U.S. Census Bureau, archived from the original on December 10, 2016, retrieved March 19, 2019
- "FAQ: Does the Census Bureau collect data on the number of unauthorized migrants?". U. S. Census Bureau. Retrieved May 13, 2009.
- "FAQ: Will 2010 Census apportionment population counts also include any Americans overseas". U. S Census Bureau. Retrieved May 13, 2009.
- Office of the Federal Register. "A Procedural Guide to the Electoral College". National Archives and Records Administration. Archived from the original on May 28, 2010. Retrieved August 13, 2010.
- Shah, Dayna K.; Reich, Mary W. (November 1997). U.S. Insular Areas: Application of the U.S. Constitution (PDF) (Report). Washington, D.C.: U.S. General Accounting Office. GAO/OGC-98-5. Archived from the original (PDF) on February 29, 2020. Retrieved July 1, 2020.
- Curry, Tom (May 28, 2008). "Nominating, but not voting for president". NBC News. Retrieved August 24, 2021.
- "US Census Quickfacts, Population Estimates, July 1 2021". Census.gov. United States Census Bureau. Archived (PDF) from the original on April 26, 2021. Retrieved April 17, 2022.
- "2020 Island Areas Censuses: Guam, Population and Housing Unit Counts, Table 1. Population of Guam: 2010 and 2020". October 28, 2021. Retrieved November 1, 2021.
- "2020 Island Areas Censuses: U.S. Virgin Islands, Population and Housing Unit Counts, Table 1. Population of the United States Virgin Islands: 2010 and 2020". October 28, 2021. Retrieved November 1, 2021.
- "2020 Island Areas Censuses: American Samoa, Population and Housing Unit Counts, Table 1. Population of American Samoa: 2010 and 2020". October 28, 2021. Retrieved November 1, 2021.
- "2020 Island Areas Censuses: Commonwealth of the Northern Mariana Islands (CNMI), Population and Housing Unit Counts, Table 1. Population of the Commonwealth of the Northern Mariana Islands: 2010 and 2020". October 28, 2021. Retrieved November 1, 2021.
- "U.S. Census Bureau QuickFacts: United States". www.census.gov. Archived from the original on April 11, 2020. Retrieved December 30, 2019.