List of Polish voivodeships by GRP
This is a list of Polish voivodeships by gross regional product (GRP) per capita shown in euros. Statistics shown are for 2019 levels.[1]
| Rank | Voivodeship (Province) |
2019 (in EUR) |
Comparable country |
|---|---|---|---|
| 1 | Warsaw | 30,500 | |
| 2 | Lower Silesia | 15,200 | |
| 3 | Greater Poland | 15,000 | |
| 4 | Silesia | 14,200 | |
| 5 | Pomerania | 13,500 | |
| 6 | Łódź | 13,100 | |
| 7 | Lesser Poland | 12,700 | |
| 8 | Masovia (regional) | 12,000 | |
| 9 | West Pomerania | 11,500 | |
| 10 | Lubusz | 11,300 | |
| 11 | Kujawy-Pomerania | 11,000 | |
| 12 | Opole | 10,900 | |
| 13 | Podlaskie | 10,000 | |
| 14 | Świętokrzyskie | 9,900 | |
| 15 | Podkarpackie | 9,700 | |
| 16 | Warmia-Masuria | 9,500 | |
| 17 | Lubelskie | 9,500 | |
| — | Poland | 13,900 |
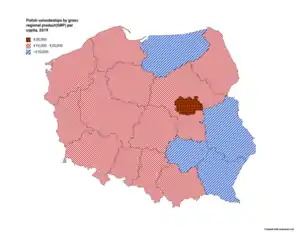
Polish voivodeships by gross regional product(GRP) per capita
This is a list of Polish voivodeships by nominal gross regional product (GRP) shown in billion euros. Statistics shown are for 2019 levels.
| Rank | Province (voivodeship) |
2019 (in billions EUR) |
Comparable country |
|---|---|---|---|
| 1 | Warsaw | 93.6 | |
| 2 | Silesia | 64.2 | |
| 3 | Greater Poland | 52.6 | |
| 4 | Lower Silesia | 44.0 | |
| 5 | Lesser Poland | 43.2 | |
| 6 | Łódź | 32.1 | |
| 7 | Pomerania | 31.6 | |
| 8 | Masovia(regional) | 28.1 | |
| 9 | Kujawy-Pomerania | 22.9 | |
| 10 | Podkarpackie | 20.7 | |
| 11 | Lubelskie | 20.0 | |
| 12 | West Pomerania | 19.6 | |
| 13 | Warmia-Masuria | 13.5 | |
| 14 | Świętokrzyskie | 12.3 | |
| 15 | Podlaskie | 11.8 | |
| 16 | Lubusz | 11.4 | |
| 17 | Opole | 10.8 | |
| — | Poland | 532.3 |
See also
References
- "Stats" (PDF). ec.europa.eu. Retrieved 2020-07-10.

This article is issued from Wikipedia. The text is licensed under Creative Commons - Attribution - Sharealike. Additional terms may apply for the media files.