List of Indian states and union territories by GDP
These are lists of Indian states and union territories by their nominal gross state domestic product (GSDP).GSDP is the sum of all value added by industries within each state or union territory and serves as a counterpart to the national gross domestic product (GDP).[1]
In India, the Government accounts for around 21% of the GDP, agriculture accounts for 21%, the corporate sector accounts for 12% and the balance 48% of the GDP is sourced from small proprietorship and partnership companies, unorganized sector and households.[2]
_vs_State_UT_(1).png.webp)
_vs_State_UT_(2).png.webp)
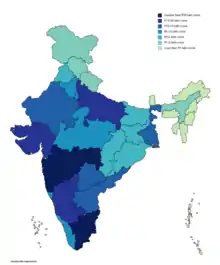
The following list gives the latest available gross state domestic product (GSDP) figures for all Indian States and Union Territories at current prices in crores (units of 10 million) or lakh crores (units of 1 trillion) of the Indian rupees. No data is available for the union territories of Dadra and Nagar Haveli and Daman and Diu, Ladakh and Lakshadweep.
List
| Rank | State/Union Territory | Nominal GDP ₹ lakh crore = INR trillions; USD billions | Data year [3][4] |
IMF Estimated Equivalent Countries in Millions[5] (2021) |
|---|---|---|---|---|
| 1 | Maharashtra | ₹32.24 lakh crore (US$430 billion) | 2020–21[6] | |
| 2 | Tamil Nadu | ₹22.44 lakh crore (US$297 billion) | 2020–21[3] | |
| 3 | Uttar Pradesh | ₹17.05 lakh crore (US$240 billion) | 2020–21[3] | |
| 4 | Gujarat | ₹16.48 lakh crore (US$230 billion) | 2020–21 | |
| 5 | Karnataka | ₹16.29 lakh crore (US$228 billion) | 2020–21 | |
| 6 | West Bengal | ₹13.54 lakh crore (US$181 billion) | 2020–21[7] | |
| 7 | Rajasthan | ₹10.21 lakh crore (US$140 billion) | 2020–21 | |
| 8 | Andhra Pradesh | ₹10.19 lakh crore (US$130 billion) | 2020–21 | |
| 9 | Kerala | ₹9.78 lakh crore (US$130 billion) | 2020–21 | |
| 10 | Telangana | ₹9.78 lakh crore (US$130 billion) | 2020–21 | |
| 11 | Madhya Pradesh | ₹9.17 lakh crore (US$120 billion) | 2020–21 | |
| 12 | Delhi | ₹8.56 lakh crore (US$110 billion) | 2020–21[8] | |
| 13 | Haryana | ₹7.65 lakh crore (US$100 billion) | 2020–21 | |
| 14 | Bihar | ₹7.57 lakh crore (US$99 billion) | 2020–21[9] | |
| 15 | Punjab | ₹5.41 lakh crore (US$71 billion) | 2020–21 | |
| 16 | Odisha | ₹5.09 lakh crore (US$67 billion) | 2020–21 | |
| 17 | Assam | ₹4.09 lakh crore (US$54 billion) | 2020–21[10] | |
| 18 | Chhattisgarh | ₹3.50 lakh crore (US$46 billion) | 2020–21 | |
| 19 | Jharkhand | ₹3.29 lakh crore (US$43 billion) | 2019–20 | |
| 20 | Uttarakhand | ₹2.53 lakh crore (US$33 billion) | 2019–20 | |
| 21 | Jammu and Kashmir | ₹1.76 lakh crore (US$23 billion) | 2020–21 | |
| 22 | Himachal Pradesh | ₹1.56 lakh crore (US$20 billion) | 2020–21 | |
| 23 | Goa | ₹0.815 lakh crore (US$11 billion) | 2020–21 | |
| 24 | Tripura | ₹0.597 lakh crore (US$7.8 billion) | 2020–21 | |
| 25 | Chandigarh | ₹0.421 lakh crore (US$5.5 billion) | 2018–19 | |
| 26 | Puducherry | ₹0.380 lakh crore (US$5.0 billion) | 2019–20 | |
| 27 | Meghalaya | ₹0.348 lakh crore (US$4.6 billion) | 2020–21 | |
| 28 | Sikkim | ₹0.325 lakh crore (US$4.3 billion) | 2019–20 | |
| 29 | Nagaland | ₹0.319 lakh crore (US$4.2 billion) | 2019–20 | |
| 30 | Manipur | ₹0.318 lakh crore (US$4.2 billion) | 2019–20 | |
| 31 | Arunachal Pradesh | ₹0.273 lakh crore (US$3.6 billion) | 2019–20 | |
| 32 | Mizoram | ₹0.265 lakh crore (US$3.5 billion) | 2019–20 | |
| 33 | Andaman and Nicobar Islands | ₹0.088 lakh crore (US$1.2 billion) | 2018–19 | |
The GSDP of the above states are compared with the nearest country's GDP (the country's GDP may be slightly larger or smaller than the respective state) in the same fiscal year (2019-20 with 2019 and 2020-21 with 2020).
| Rank | Zonal councils | Nominal GDP | Data year | Population (2018) |
IMF Estimated Equivalent Countries in Millions[5] (2021) | |
|---|---|---|---|---|---|---|
| (₹ lakh crore or INR trillions) | (USD, $) | |||||
| 1 | Southern | 63.10 | $860 billion | 2020 | 266,376,000 | |
| 2 | Western | 44.54 | $610 billion | 2020 | 179,550,000 | |
| 3 | Northern | 36.46 | $500 billion | 2020 | 162,809,000 | |
| 4 | Eastern | 33.27 | $468 billion | 2020 | 323,495,000 | |
| 5 | Central | 32.78 | $450 billion | 2020 | 350,000,000 | |
| 6 | North-Eastern | 5.61 | $77 billion | 2020 | 50,524,000 | |
| India | 203.85 | $3.25 trillion | 2022[11] | 1,303,714,000 | ||
Nominal GSDP from 2011–12 to 2020–21
The following table shows the annual growth in nominal GSDP for the financial years 2011–12 to 2020–21, from the Ministry of Statistics and Programme Implementation.[12][13] Revised data for the past years differ from the tables below.[3] Figures are in crores (units of 10 million) of Indian rupees at current prices.[1] No data was available for the union territories of Dadra and Nagar Haveli, Daman and Diu and Lakshadweep.
| State/union territory | 2011–12 in ₹ crore |
2012–13 in ₹ crore |
2013–14 in ₹ crore |
2014–15 in ₹ crore |
2015–16 in ₹ crore |
2016–17 in ₹ crore |
2017–18 in ₹ crore |
2018–19 in ₹ crore |
2019–20 in ₹ crore |
2020–21 in ₹ crore |
|---|---|---|---|---|---|---|---|---|---|---|
| 87,36,039 | 99,46,636 | 1,12,36,635 | 1,24,33,749 | 1,36,75,331 | 1,52,51,028 | 1,70,95,005 | 1,90,10,164 | – | – | |
| Andhra Pradesh | 3,79,402 | 4,11,404 | 4,64,272 | 5,24,976 | 6,04,229 | 6,97,508 | 8,09,547 | 9,33,402 | 10,80,657 | – |
| Arunachal Pradesh | 11,063 | 12,547 | 14,581 | 17,959 | 18,509 | 19,627 | 22,045 | – | – | – |
| Assam | 1,43,175 | 1,56,864 | 1,77,745 | 1,95,723 | 2,27,959 | 2,54,478 | 2,88,494 | 3,32,939 | 3,74,096 | 4,08,627 |
| Bihar | 2,47,144 | 2,82,368 | 3,17,101 | 3,42,951 | 3,71,602 | 4,22,316 | 4,84,740 | 5,57,490 | 5,72,827 | – |
| Chhattisgarh | 1,58,074 | 1,77,511 | 2,06,833 | 2,21,118 | 2,27,383 | 2,54,722 | 2,84,194 | 3,11,660 | 3,63,900 | – |
| Goa | 42,367 | 38,120 | 35,921 | 47,814 | 55,054 | 63,460 | 70,493 | 77,172 | – | – |
| Gujarat | 6,15,606 | 7,24,495 | 8,07,623 | 9,21,773 | 10,29,010 | 11,53,327 | 13,14,680 | 14,99,013 | 17,01,495 | 17,78,000 |
| Haryana | 2,97,539 | 3,47,032 | 3,99,268 | 4,37,145 | 4,95,249 | 5,56,325 | 6,26,054 | 7,07,126 | 7,84,910 | – |
| Himachal Pradesh | 72,720 | 82,820 | 94,764 | 1,03,772 | 1,14,239 | 1,25,634 | 1,40,613 | 1,53,181 | 1,68,972 | – |
| Jammu and Kashmir | 78,256 | 87,138 | 95,619 | 98,370 | 1,17,168 | 1,25,379 | 1,38,488 | – | – | – |
| Jharkhand | 1,50,918 | 1,74,724 | 1,88,567 | 2,18,525 | 2,06,613 | 2,36,250 | 2,76,243 | 3,07,581 | 3,29,726 | 3,83,233 |
| Karnataka | 6,06,048 | 6,95,413 | 8,16,666 | 9,13,923 | 10,45,168 | 12,09,136 | 13,50,257 | 15,35,224 | 15,88,303 | 18,03,609 |
| Kerala | 3,64,048 | 4,12,313 | 4,65,041 | 5,12,564 | 5,61,994 | 6,34,886 | 7,01,577 | 7,81,653 | 8,75,514 | 9,78,064 |
| Madhya Pradesh | 3,15,562 | 3,80,925 | 4,39,483 | 4,79,939 | 5,41,189 | 6,48,849 | 7,28,242 | 8,09,327 | 9,06,672 | 9,17,555 |
| Maharashtra | 12,80,369 | 14,59,629 | 16,49,647 | 17,79,138 | 19,66,147 | 21,88,532 | 24,11,600 | 26,56,551 | 29,79,556 | 30,79,086 |
| Manipur | 12,915 | 13,743 | 16,182 | 18,129 | 19,531 | 21,294 | 23,968 | – | – | – |
| Meghalaya | 19,918 | 21,872 | 22,938 | 23,235 | 25,117 | 27,439 | 30,790 | – | – | – |
| Mizoram | 7,259 | 8,362 | 10,293 | 13,509 | 15,139 | 17,192 | 19,457 | – | – | – |
| Nagaland | 12,177 | 14,121 | 16,612 | 18,401 | 19,524 | 21,722 | 24,281 | – | – | – |
| Odisha | 2,30,987 | 2,61,700 | 2,96,475 | 3,14,250 | 3,28,550 | 3,93,808 | 4,36,374 | 4,85,376 | 5,40,812 | – |
| Punjab | 2,66,628 | 2,97,734 | 3,32,147 | 3,55,102 | 3,90,087 | 4,26,988 | 4,79,141 | 5,21,861 | 5,77,829 | – |
| Rajasthan | 4,34,837 | 4,93,551 | 5,61,031 | 6,15,642 | 6,81,485 | 7,58,809 | 8,35,558 | 9,29,124 | – | – |
| Sikkim | 11,165 | 12,338 | 13,862 | 15,407 | 18,034 | 20,687 | 23,495 | 26,786 | – | – |
| Tamil Nadu | 7,51,486 | 8,54,825 | 9,68,530 | 10,72,678 | 11,76,500 | 13,02,639 | 14,61,841 | 16,64,159 | 18,54,239 | 21,24,000 |
| Telangana | 3,59,434 | 4,01,594 | 4,51,580 | 5,05,849 | 5,77,902 | 6,59,033 | 7,53,811 | 8,65,688 | 9,69,604 | – |
| Tripura | 19,208 | 21,663 | 25,593 | 29,533 | 35,938 | 39,612 | 46,133 | – | – | – |
| Uttar Pradesh | 7,24,050 | 8,22,393 | 9,40,356 | 10,11,790 | 11,37,210 | 12,48,374 | 13,76,324 | 15,42,432 | 17,91,000 | 19,48,000 |
| Uttarakhand | 1,15,328 | 1,31,613 | 1,49,074 | 1,61,439 | 1,77,163 | 1,95,125 | 2,22,836 | 2,45,895 | 2,63,233 | – |
| West Bengal | 5,20,485 | 5,91,464 | 6,76,848 | 7,18,082 | 7,97,300 | 8,72,527 | 9,99,585 | 11,77,586 | 13,14,529 | - |
| Andaman and Nicobar Islands | 3,978 | 4,421 | 5,023 | 5,477 | 6,032 | 6,836 | 7,871 | – | – | – |
| Chandigarh | 18,768 | 21,609 | 24,822 | 26,549 | 29,280 | 32,741 | 38,806 | – | – | – |
| Delhi | 3,43,798 | 3,91,388 | 4,43,960 | 4,94,803 | 5,50,804 | 6,15,605 | 6,90,098 | 7,79,652 | – | – |
| Puducherry | 16,818 | 18,875 | 21,870 | 22,574 | 26,617 | 29,573 | 32,962 | 36,656 | – | – |
Nominal GDP from 2001–02 to 2010–11
The following table shows the annual growth in nominal GSDP for the financial years 2001–02 to 2010–11, released by the Planning Commission of India, in the Indian rupees.[1]
Revised data for the past years differ from the tables below. Figures are in crores (units of 10 million) of Indian rupees at current prices.[1] No data was available for the union territories of Dadra and Nagar Haveli, Daman and Diu and Lakshadweep.
| State/union territory | 2001–02 | 2002–03 | 2003–04 | 2004–05 | 2005–06 | 2006–07 | 2007–08 | 2008–09 | 2009–10 | 2010–11 |
|---|---|---|---|---|---|---|---|---|---|---|
| 20,97,726 | 22,61,415 | 25,38,170 | 29,71,464 | 33,90,503 | 39,53,276 | 45,82,086 | 53,03,567 | 61,08,903 | 72,48,860 | |
| Andhra Pradesh | 1,56,711 | 1,67,096 | 1,90,017 | 2,24,713 | 2,55,941 | 3,01,035 | 3,64,813 | 4,26,765 | 4,76,835 | 5,83,762 |
| Arunachal Pradesh | 2,104 | 2,071 | 2,368 | 3,488 | 3,755 | 4,108 | 4,810 | 5,687 | 7,474 | 9,013 |
| Assam | 38,313 | 43,407 | 47,305 | 53,398 | 59,385 | 64,692 | 71,076 | 81,074 | 95,975 | 1,12,688 |
| Bihar | 57,657 | 64,965 | 66,174 | 77,781 | 82,490 | 1,00,737 | 1,13,680 | 1,42,279 | 1,62,923 | 2,04,289 |
| Chhattisgarh | 29,539 | 32,493 | 38,802 | 47,862 | 53,381 | 66,875 | 80,255 | 96,972 | 99,364 | 1,19,420 |
| Goa | 7,097 | 8,100 | 9,301 | 12,713 | 14,327 | 16,523 | 19,565 | 25,414 | 29,126 | 33,605 |
| Gujarat | 1,23,573 | 1,41,534 | 1,68,080 | 2,03,373 | 2,44,736 | 2,83,693 | 3,29,285 | 3,67,912 | 4,31,262 | 5,21,519 |
| Haryana | 65,505 | 72,528 | 82,862 | 95,795 | 1,08,885 | 1,28,732 | 1,51,596 | 1,82,522 | 2,23,600 | 2,60,621 |
| Himachal Pradesh | 17,148 | 18,905 | 20,721 | 24,077 | 27,127 | 30,274 | 33,963 | 41,483 | 48,189 | 57,452 |
| Jammu and Kashmir | 18,039 | 20,326 | 22,194 | 27,305 | 29,920 | 33,230 | 37,099 | 42,315 | 48,385 | 58,073 |
| Jharkhand | 35,069 | 37,967 | 42,449 | 59,758 | 60,901 | 66,935 | 83,950 | 87,794 | 1,00,621 | 1,27,281 |
| Karnataka | 1,12,847 | 1,20,889 | 1,30,990 | 1,66,747 | 1,95,904 | 2,27,237 | 2,70,629 | 3,10,312 | 3,37,559 | 4,10,703 |
| Kerala | 77,924 | 86,895 | 96,698 | 1,19,264 | 1,36,842 | 1,53,758 | 1,75,141 | 2,02,783 | 2,31,999 | 2,63,773 |
| Madhya Pradesh | 86,745 | 86,832 | 1,02,839 | 1,12,927 | 1,24,276 | 1,44,577 | 1,61,479 | 1,97,276 | 2,27,984 | 2,63,396 |
| Maharashtra | 2,73,188 | 2,99,479 | 3,40,600 | 4,15,480 | 4,86,766 | 5,84,498 | 6,84,817 | 7,53,969 | 8,55,751 | 10,35,086 |
| Manipur | 3,369 | 3,506 | 3,979 | 5,133 | 5,718 | 6,137 | 6,783 | 7,399 | 8,254 | 9,137 |
| Meghalaya | 4,478 | 4,763 | 5,280 | 6,559 | 7,265 | 8,625 | 9,735 | 11,617 | 12,709 | 14,583 |
| Mizoram | 1,947 | 2,166 | 2,325 | 2,682 | 2,971 | 3,290 | 3,816 | 4,577 | 5,260 | 6,388 |
| Nagaland | 3,972 | 4,467 | 4,812 | 5,839 | 6,588 | 7,257 | 8,075 | 9,436 | 10,527 | 11,759 |
| Odisha | 46,756 | 49,713 | 61,008 | 77,729 | 85,096 | 1,01,839 | 1,29,274 | 1,48,491 | 1,62,946 | 1,97,530 |
| Punjab | 79,611 | 82,249 | 90,089 | 96,839 | 1,08,637 | 1,27,123 | 1,52,245 | 1,74,039 | 1,97,500 | 2,26,204 |
| Rajasthan | 91,771 | 88,550 | 111,606 | 127,746 | 1,42,236 | 1,71,043 | 1,94,822 | 2,30,949 | 2,65,825 | 3,38,348 |
| Sikkim | 1,136 | 1,276 | 1,430 | 1,739 | 1,993 | 2,161 | 2,506 | 3,229 | 6,133 | 7,412 |
| Tamil Nadu | 1,48,861 | 1,58,155 | 1,75,371 | 2,19,003 | 2,57,833 | 3,10,526 | 3,50,819 | 4,01,336 | 4,79,733 | 5,84,896 |
| Telangana | – | – | – | – | – | – | – | – | – | – |
| Tripura | 6,370 | 6,733 | 7,551 | 8,904 | 9,826 | 10,914 | 11,797 | 13,573 | 15,403 | 17,868 |
| Uttar Pradesh | 1,90,269 | 2,06,855 | 2,26,972 | 2,60,841 | 2,93,172 | 3,36,317 | 3,83,026 | 4,44,685 | 5,23,394 | 6,00,164 |
| Uttarakhand | 15,144 | 18,473 | 20,439 | 24,786 | 29,968 | 36,795 | 45,856 | 56,025 | 70,730 | 83,969 |
| West Bengal | 1,57,144 | 1,68,000 | 1,89,259 | 2,08,656 | 2,30,245 | 2,61,682 | 2,99,483 | 3,41,942 | 3,98,880 | 4,60,959 |
| Andaman and Nicobar Islands | 1,082 | 1,228 | 1,392 | 1,813 | 2,044 | 2,538 | 2,990 | 3,480 | 4,120 | 4,345 |
| Chandigarh | 5,490 | 6,453 | 7,419 | 8,504 | 10,185 | 12,276 | 13,669 | 15,334 | 17,717 | 20,017 |
| Delhi | 65,027 | 71,361 | 79,468 | 1,00,325 | 1,15,374 | 1,35,584 | 1,57,947 | 1,89,553 | 2,19,753 | 2,52,753 |
| Puducherry | 4,259 | 4,931 | 5,438 | 5,754 | 7,977 | 8,335 | 9,251 | 10,050 | 12,304 | 13,092 |
Nominal GSDP growth rate
This table shows annual growth in each state's nominal GSDP growth in percentage.[1][13] No data was available for the union territories of Dadra and Nagar Haveli, Daman and Diu and Lakshadweep.
| State/union territory | 2010–11 | 2011–12 | 2012–13 | 2013–14 | 2014–15 | 2015–16 | 2016–17 | 2017–18 | 2018–19 |
|---|---|---|---|---|---|---|---|---|---|
| 18.66 | 15.77 | 13.80 | 13.0 | 11.0 | 10.4 | 10.8 | 10.0 | 11.2 | |
| Andhra Pradesh | 17.03 | 13.25 | 13.20 | 12.90 | 13.40 | 15.90 | 14.70 | 16.06 | 15.23 |
| Arunachal Pradesh | 20.59 | 17.82 | 13.86 | 16.20 | 23.2 | 3.3 | 9.20 | – | – |
| Assam | 17.41 | 11.65 | 9.60 | 13.30 | 10.10 | 16.50 | 11.60 | – | – |
| Bihar | 25.39 | 21.06 | 14.30 | 12.30 | 8.20 | 7.70 | 15.30 | 14.50 | – |
| Chhattisgarh | 20.18 | 11.26 | 12.30 | 16.50 | 6.90 | 5.90 | 12.90 | 11.20 | 16.76 |
| Goa | 15.38 | 7.20 | −10.00 | −5.80 | 33.10 | 15.10 | 13.80 | 9.47 | – |
| Gujarat | 20.93 | 14.01 | 17.70 | 11.50 | 14.10 | 11.60 | 13.00 | 14.02 | 13.50 |
| Haryana | 16.56 | 15.86 | 16.60 | 15.50 | 9.20 | 10.90 | 12.80 | 12.94 | 11.00 |
| Himachal Pradesh | 19.22 | 13.06 | 13.90 | 14.40 | 9.50 | 10.10 | 10.30 | 8.10 | 10.30 |
| Jammu and Kashmir | 20.02 | 13.24 | 11.40 | 9.70 | 2.90 | 19.10 | 8.20 | – | – |
| Jharkhand | 26.50 | 13.05 | 15.80 | 7.90 | 15.90 | −5.50 | 14.00 | 8.40 | 7.20 |
| Karnataka | 21.7 | 10.8 | 14.80 | 17.40 | 11.80 | 11.00 | 11.80 | 12.10 | – |
| Kerala | 13.70 | 16.73 | 13.30 | 12.80 | 10.20 | 9.60 | 10.70 | – | – |
| Madhya Pradesh | 15.53 | 18.33 | 20.70 | 15.40 | 9.20 | 13.10 | 19.30 | 11.13 | 18.91 |
| Maharashtra | 20.96 | 15.89 | 14.00 | 13.00 | 7.90 | 11.60 | 13.60 | 10.6 | 12.15 |
| Manipur | 10.70 | 14.96 | 6.40 | 17.70 | 12.00 | 7.70 | 7.90 | – | – |
| Meghalaya | 14.75 | 12.54 | 9.80 | 4.90 | 1.30 | 8.10 | 8.40 | – | – |
| Mizoram | 21.44 | 12.68 | 15.20 | 23.10 | 31.20 | 12.10 | 16.30 | – | – |
| Nagaland | 11.70 | 12.28 | 16.00 | 17.60 | 10.80 | 6.10 | 10.10 | – | – |
| Odisha | 21.22 | 8.63 | 13.30 | 13.30 | 6.00 | 5.30 | 14.00 | 10.30 | 11.42 |
| Punjab | 14.53 | 13.36 | 11.70 | 11.60 | 6.90 | 9.90 | 9.80 | 10.07 | 10.72 |
| Rajasthan | 27.28 | 19.23 | 13.50 | 11.60 | 11.70 | 11.10 | 11.00 | 10.70 | – |
| Sikkim | 20.85 | 16.24 | 10.5 | 12.30 | 11.10 | 17.10 | 11.00 | 11.10 | – |
| Tamil Nadu | 21.92 | 13.75 | 13.80 | 13.30 | 10.80 | 9.70 | 8.00 | 12.30 | 11.42 |
| Telangana | 29.78 | 11.99 | 11.70 | 12.40 | 12.00 | 14.20 | 14.00 | 14.10 | 12.00 |
| Tripura | 16.00 | 17.43 | 12.80 | 18.10 | 7.10 | 25.30 | 15.14 | – | – |
| Uttar Pradesh | 14.67 | 13.14 | 13.40 | 14.30 | 7.60 | 12.40 | 9.90 | 10.00 | – |
| Uttarakhand | 18.72 | 16.35 | 14.10 | 13.30 | 8.30 | 8.90 | 11.30 | 11.20 | – |
| West Bengal | 15.56 | 12.91 | 13.64 | 14.44 | 6.09 | 11.03 | 9.44 | 14.56 | 17.81 |
| Chandigarh | 12.98 | 15.96 | 15.10 | 14.90 | 7.00 | 10.40 | 8.60 | – | – |
| Delhi | 15.20 | 17.49 | 13.80 | 13.40 | 11.50 | 10.70 | 12.50 | 11.20 | – |
| Puducherry | 6.40 | 11.75 | 12.20 | 15.90 | 3.20 | 18.00 | 9.90 | 10.00 | – |
| Andaman and Nicobar Islands | 5.46 | 9.23 | 11.10 | 13.60 | 9.10 | 10.10 | 10.20 | – | – |
See also
References
- "Gross State Domestic Product (GSDP) at Current Prices (as on 31-05-2014)" (PDF). Planning Commission Government of India. Archived from the original (PDF) on 15 July 2014.
- "National economic debate – Stock markets or rigged casinos – talk by Professor Dr. R. Vaidyanathan (IIM Bangalore) – 21 Jan 2011, Mumbai". National Economic Debates. Retrieved 1 November 2016.
- "MOSPI State Domestic Product, Ministry of Statistics and Programme Implementation, Government of India". 15 March 2021. Retrieved 17 April 2021.
- "World Economic Outlook Database, October 2019". IMF.org. International Monetary Fund. 15 October 2019. Retrieved 3 September 2019.
- "World Economic Outlook Database, April 2021". IMF.org. International Monetary Fund. April 2021. Retrieved 8 May 2021.
- "Maharastra Budget Analysis 2020-2021". Retrieved 12 December 2021.
- "WB Finance Department" (PDF). Retrieved 11 October 2021.
- "Delhi Budbet Analysis 2020-2021". Retrieved 22 March 2022.
- "Rs 90.18 lakh crore Bihar budget off". www.timesofindia.indiatimes.com. Retrieved 13 May 2021.
- "Assam Budget 2021". 16 July 2021. Retrieved 17 July 2021.
- "Second Advance Estimates of National Income, 2019-20 and Quarterly Estimates of Gross Domestic Product for the Third Quarter (Oct-Dec), 2019-20". Press Information Bureau, Government of India. 28 February 2020. Retrieved 8 March 2021.
- "State Domestic Product and other aggregates, 2004–05 series". Ministry of Statistics and Programme Implementation. 27 February 2015. Archived from the original on 23 March 2015. Retrieved 18 June 2015.
- "MOSPI GSDP". MOSPI.