List of Chinese administrative divisions by GDP
The article lists China's province-level divisions by gross domestic product (GDP). Each province's GDP is listed in both the national currency renminbi (CN¥), and at nominal U.S. dollar values according to annual average exchange rates and according to purchasing power parity (PPP). Historical figures and rankings, including purchasing power parity (PPP) figures, are also given for main years since 1978. Figures for Hong Kong and Macau, which are special administrative regions of the People's Republic of China.
 |
| First or provincial level Administrative divisions of China by: |
|---|
All the CN¥ figures are from the National Bureau of Statistics of China. Annual PPP rates are taken from the International Monetary Fund's World Economic Outlook (WEO) databases.
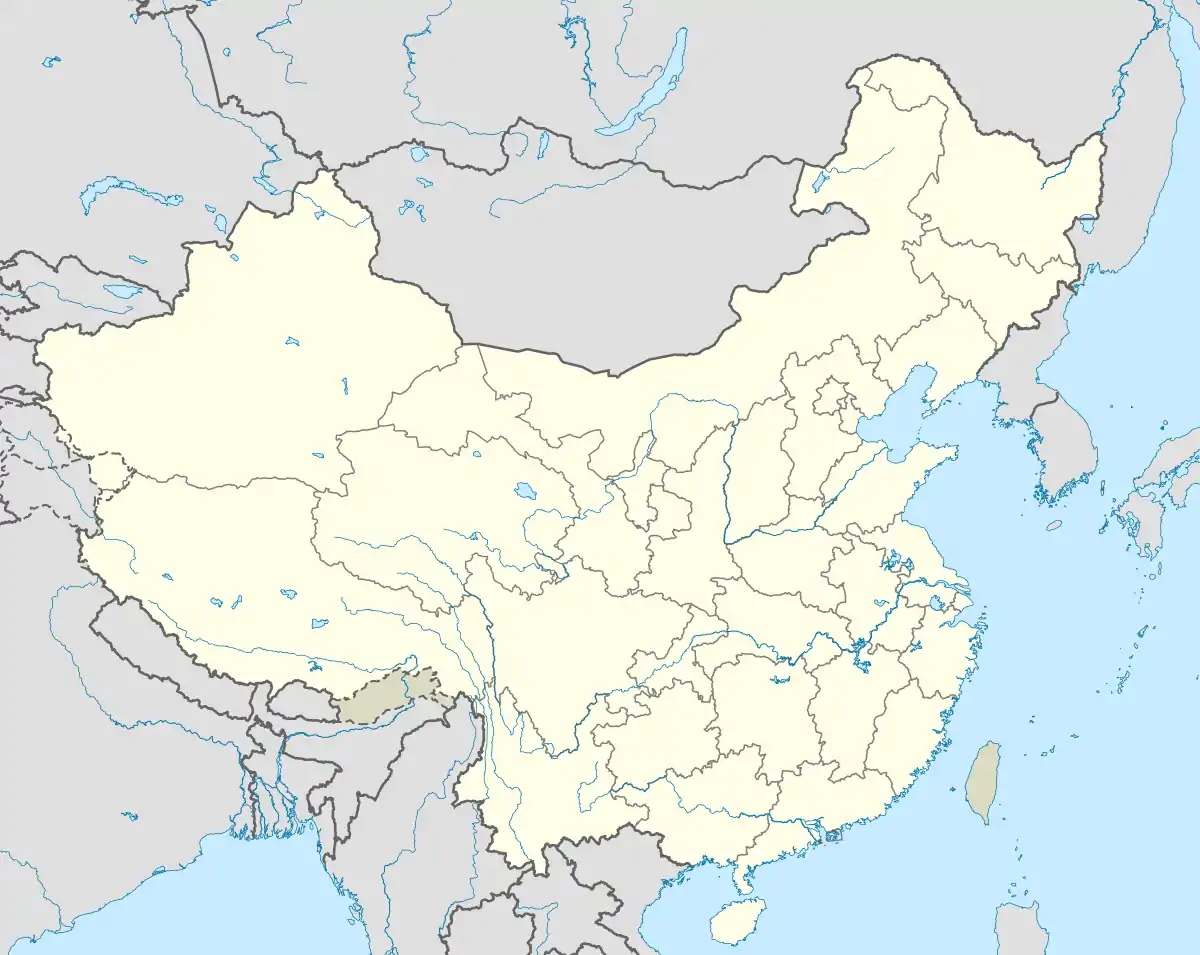
Map
This is map of Chinese provinces and SARs by GDP in US Dollars (2021)
| >$1 trillion $500 billion - $1.0 trillion $200 - $500 billion <$200 billion |
2021
| preliminary estimation; average rate: CN¥ 6.3527 per U.S. dollar | ||||||
|---|---|---|---|---|---|---|
| Provinces / SARs | Rank | GDP (CN¥) | Nominal GDP (US$) | Comparable economy | ||
| China (mainland) | 113,774.31 | 17,909.60 (excluding SARs) | ||||
| Guangdong | 1 | 12,369.67 | 1,947.15 | |||
| Jiangsu | 2 | 11,636.42 | 1,831.73 | |||
| Shandong | 3 | 8,309.59 | 1,308.04 | |||
| Zhejiang | 4 | 7,351.58 | 1,157.23 | |||
| Henan | 5 | 5,888.74 | 926.97 | |||
| Sichuan | 6 | 5,385.08 | 847.68 | |||
| Hubei | 7 | 5,001.29 | 787.27 | |||
| Fujian | 8 | 4,881.04 | 768.34 | |||
| Hunan | 9 | 4,606.31 | 725.09 | |||
| Shanghai | 10 | 4,321.48 | 680.27 | |||
| Anhui | 11 | 4,295.92 | 676.23 | |||
| Hebei | 12 | 4,039.13 | 635.81 | |||
| Beijing | 13 | 4,026.96 | 633.90 | |||
| Shaanxi | 14 | 2,980.09 | 469.11 | |||
| Jiangxi | 15 | 2,961.97 | 466.25 | |||
| Chongqing | 16 | 2,789.40 | 439.09 | |||
| Liaoning | 17 | 2,758.41 | 434.21 | |||
| Yunnan | 18 | 2,714.68 | 427.33 | |||
| Guangxi | 19 | 2,474.09 | 389.45 | |||
| Hong Kong | 369.72 | |||||
| Shanxi | 20 | 2,259.02 | 355.60 | |||
| Inner Mongolia | 21 | 2,051.42 | 322.92 | |||
| Guizhou | 22 | 1,958.64 | 308.32 | |||
| Xinjiang | 23 | 1,598.37 | 251.60 | |||
| Tianjin | 24 | 1,569.51 | 247.06 | |||
| Heilongjiang | 25 | 1,487.92 | 234.22 | |||
| Jilin | 26 | 1,323.56 | 208.35 | |||
| Gansu | 27 | 1,024.33 | 161.24 | |||
| Hainan | 28 | 647.52 | 101.92 | |||
| Ningxia | 29 | 452.23 | 71.19 | |||
| Qinghai | 30 | 334.66 | 52.68 | |||
| Tibet | 31 | 208.02 | 32.75 | |||
| Macau | 29.22 | |||||
Appendix
GDP figures for Hong Kong and Macau SARs are given in both US dollars and in their respective local currencies (Hong Kong dollars and Macanese patacas). PPP figures are given in Int'l. dollars .[3]
Appendix | ||||||||||||||||||||||||||||||||||||||||||||||||||||||||||||||||||||||||||||||||||||||||||||||||||||||||||||||||||||||||||||||||||||||||||||||||||||||||||||||||||||||||||||||||||||||||||||||||||||||||||||||||||||||||||||||||||||||||||||||||||||||||||||||||||||
|---|---|---|---|---|---|---|---|---|---|---|---|---|---|---|---|---|---|---|---|---|---|---|---|---|---|---|---|---|---|---|---|---|---|---|---|---|---|---|---|---|---|---|---|---|---|---|---|---|---|---|---|---|---|---|---|---|---|---|---|---|---|---|---|---|---|---|---|---|---|---|---|---|---|---|---|---|---|---|---|---|---|---|---|---|---|---|---|---|---|---|---|---|---|---|---|---|---|---|---|---|---|---|---|---|---|---|---|---|---|---|---|---|---|---|---|---|---|---|---|---|---|---|---|---|---|---|---|---|---|---|---|---|---|---|---|---|---|---|---|---|---|---|---|---|---|---|---|---|---|---|---|---|---|---|---|---|---|---|---|---|---|---|---|---|---|---|---|---|---|---|---|---|---|---|---|---|---|---|---|---|---|---|---|---|---|---|---|---|---|---|---|---|---|---|---|---|---|---|---|---|---|---|---|---|---|---|---|---|---|---|---|---|---|---|---|---|---|---|---|---|---|---|---|---|---|---|---|---|---|---|---|---|---|---|---|---|---|---|---|---|---|---|---|---|---|---|---|---|---|---|---|---|---|---|---|---|---|---|---|---|
|
Historical GDP of Hong Kong SAR
Historical GDP of Macau SAR
| ||||||||||||||||||||||||||||||||||||||||||||||||||||||||||||||||||||||||||||||||||||||||||||||||||||||||||||||||||||||||||||||||||||||||||||||||||||||||||||||||||||||||||||||||||||||||||||||||||||||||||||||||||||||||||||||||||||||||||||||||||||||||||||||||||||
See also
Notes
This is a list of the first-level administrative divisions of Mainland China (including all provinces, autonomous regions, and municipalities) in order of their total gross domestic product.
References
- GDP-2021 is a preliminary data "Home - Regional - Quarterly by Province" (Press release). China NBS. March 1, 2021. Retrieved March 23, 2021.
- "Report for Selected Countries and Subjects".
- ("Download WEO Data: October 2020 Edition" (Press release). International Monetary Fund. October 10, 2020. Retrieved October 10, 2020.)