List of U.S. states and territories by GDP
This is a list of U.S. states and territories by Gross Domestic Product (GDP). This article presents the 50 U.S. states and the District of Columbia and their nominal GDP at current prices.
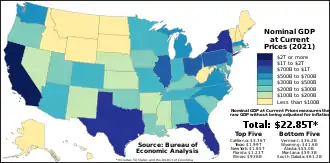
The data source for the list is the Bureau of Economic Analysis (BEA) in 2021. The BEA defined GDP by state as "the sum of value added from all industries in the state."[1]
Nominal GDP does not take into account differences in the cost of living in different countries, and the results can vary greatly from one year to another based on fluctuations in the exchange rates of the country's currency. Such fluctuations may change a country's ranking from one year to the next, even though they often make little or no difference in the standard of living of its population.[2]
Overall, in the calendar year 2021, the United States' Nominal GDP at Current Prices totalled at $23.00 Trillion, as compared to $20.89 Trillion in 2020.
The three U.S. states with the highest GDPs were California ($3.36 Trillion), Texas ($1.99 Trillion), and New York ($1.85 Trillion). The three U.S. states with the lowest GDPs were Vermont ($36.1 Billion), Wyoming ($41.6 Billion), and Alaska ($55.0 Billion).
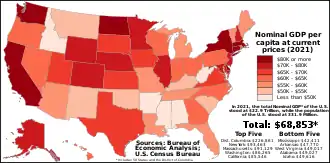
GDP per capita also varied widely throughout the United States in 2021, with New York ($93,463), Massachusetts ($91,130), and Washington state ($86,265) recorded the three highest GDP per capita figures in the U.S, while Mississippi ($42,411), Arkansas ($47,770), West Virginia ($49,017) and recorded the three lowest GDP per capita figures in the U.S. The District of Columbia, though, recorded a GDP per capita figure far higher than any U.S. state in 2021 at $226,861.
List
In the list below, you can find the annual Nominal GDP of each state and territory of the U.S. in both 2020 and in 2021, as well as the GDP change and GDP per capita for those two years. The list is initially sorted by Nominal GDP in 2021, but you can click the table headers to sort by any column.[1][3]
The raw GDP data below is measured in Millions of U.S. Dollars
The GDP data below does not reflect the fourth-quarter 2021 GDP totals, but rather the annual totals.
* indicates "GDP of STATE or TERRITORY" or "Economy of STATE or TERRITORY" links.
| State or territory | Nominal GDP at current prices (millions of U.S. dollars)[1] |
Annual GDP change at current prices (2020 - 2021)[1] |
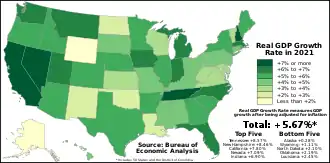
Real GDP growth rate (2020 - 2021)[1] |
Nominal GDP per capita[1][3] | % of national[1] | ||||
|---|---|---|---|---|---|---|---|---|---|
| 2021 | 2020 | 2021 | 2020 | 2021 | 2020 | ||||
| 3,356,631.4 | 3,007,187.7 | $85,546 | $76,132 | 14.69% | 14.49% | ||||
| 1,985,318.5 | 1,775,587.8 | $67,235 | $60,771 | 8.69% | 8.55% | ||||
| 1,853,925.9 | 1,724,759.1 | $93,463 | $85,575 | 8.11% | 8.31% | ||||
| 1,226,297.5 | 1,106,035.5 | $56,301 | $51,277 | 5.37% | 5.33% | ||||
| 938,347.3 | 858,366.9 | $74,052 | $67,137 | 4.11% | 4.13% | ||||
| 839,436.5 | 771,897.9 | $64,751 | $59,424 | 3.67% | 3.72% | ||||
| 736,449.8 | 677,561.2 | $62,517 | $57,466 | 3.22% | 3.26% | ||||
| 683,302.1 | 622,627.8 | $63,271 | $58,050 | 2.99% | 3.00% | ||||
| 672,089.4 | 618,579.3 | $72,524 | $66,659 | 2.94% | 2.98% | ||||
| 667,576.8 | 604,253.8 | $86,265 | $78,284 | 2.92% | 2.91% | ||||
| 654,985.7 | 589,829.0 | $62,077 | $56,404 | 2.87% | 2.84% | ||||
| 636,514.3 | 582,476.8 | $91,129 | $82,948 | 2.79% | 2.81% | ||||
| 591,851.0 | 549,535.8 | $68,483 | $63,662 | 2.59% | 2.65% | ||||
| 568,413.2 | 515,119.9 | $56,554 | $51,166 | 2.49% | 2.48% | ||||
| 438,234.9 | 410,674.7 | $71,083 | $66,531 | 1.92% | 1.98% | ||||
| 421,941.4 | 382,584.7 | $72,597 | $66,142 | 1.85% | 1.84% | ||||
| 420,339.2 | 375,336.7 | $61,760 | $55,313 | 1.84% | 1.81% | ||||
| 418,294.2 | 369,574.3 | $59,969 | $53,406 | 1.83% | 1.78% | ||||
| 412,000.8 | 373,739.3 | $72,187 | $65,486 | 1.80% | 1.80% | ||||
| 411,191.8 | 373,719.0 | $56,511 | $52,065 | 1.80% | 1.80% | ||||
| 365,931.3 | 337,714.0 | $62,065 | $57,314 | 1.60% | 1.63% | ||||
| 359,952.0 | 329,367.2 | $58,356 | $53,517 | 1.58% | 1.59% | ||||
| 296,497.6 | 276,422.9 | $82,233 | $76,779 | 1.30% | 1.33% | ||||
| 270,079.0 | 244,881.7 | $52,031 | $47,728 | 1.18% | 1.18% | ||||
| 266,943.1 | 243,776.8 | $62,867 | $57,474 | 1.17% | 1.17% | ||||
| 255,306.6 | 235,437.4 | $55,213 | $50,619 | 1.12% | 1.13% | ||||
| 247,092.5 | 226,896.5 | $49,027 | $45,155 | 1.08% | 1.09% | ||||
| 234,498.2 | 212,539.6 | $52,002 | $47,190 | 1.03% | 1.02% | ||||
| 220,342.0 | 197,561.9 | $66,011 | $60,201 | 0.96% | 0.95% | ||||
| 219,841.7 | 194,267.6 | $68,849 | $60,924 | 0.96% | 0.94% | ||||
| 206,750.5 | 188,056.6 | $51,861 | $47,465 | 0.90% | 0.91% | ||||
| 192,963.8 | 170,943.8 | $61,375 | $54,894 | 0.84% | 0.82% | ||||
| 192,303.6 | 175,141.8 | $65,530 | $59,656 | 0.84% | 0.84% | ||||
| 152,007.9 | 144,554.8 | $226,861 | $209,471 | 0.67% | 0.70% | ||||
| 150,387.7 | 133,439.0 | $76,584 | $68,031 | 0.66% | 0.64% | ||||
| 144,545.4 | 130,750.7 | $47,770 | $43,407 | 0.63% | 0.63% | ||||
| 125,110.0 | 113,845.7 | $42,411 | $38,502 | 0.55% | 0.55% | ||||
| 108,928.0 | 98,472.1 | $51,481 | $46,502 | 0.48% | 0.47% | ||||
| 98,241.8 | 87,621.0 | $70,729 | $63,593 | 0.43% | 0.42% | ||||
| 94,316.8 | 83,821.6 | $49,616 | $45,364 | 0.41% | 0.40% | ||||
| 90,059.4 | 82,884.6 | $62,474 | $57,087 | 0.39% | 0.40% | ||||
| 87,394.5 | 75,855.0 | $49,017 | $42,382 | 0.38% | 0.37% | ||||
| 80,718.2 | 75,786.5 | $80,446 | $76,406 | 0.35% | 0.37% | ||||
| 76,057.2 | 69,271.8 | $55,425 | $50,850 | 0.33% | 0.33% | ||||
| 65,939.2 | 60,556.3 | $60,185 | $55,241 | 0.29% | 0.29% | ||||
| 63,386.8 | 54,854.2 | $81,795 | $70,420 | 0.28% | 0.26% | ||||
| 61,205.5 | 54,789.4 | $68,357 | $61,762 | 0.27% | 0.26% | ||||
| 59,302.8 | 51,508.8 | $53,703 | $47,421 | 0.26% | 0.25% | ||||
| 54,970.1 | 49,820.0 | $75,027 | $68,019 | 0.24% | 0.24% | ||||
| 41,622.4 | 36,323.5 | $71,911 | $62,923 | 0.18% | 0.17% | ||||
| 36,170.1 | 33,435.0 | $56,028 | $52,039 | 0.16% | 0.16% | ||||
| 22,852,007.4 | 20,760,045.0 | $68,853 | $62,624 | 100% | 100% | ||||
See also
References
- "GDP by State". GDP by State | U.S. Bureau of Economic Analysis (BEA). Bureau of Economic Analysis. Retrieved 10 April 2022.
- Moffatt, Mike. "A Beginner's Guide to Purchasing Power Parity Theory". About.com. IAC/InterActiveCorp. Retrieved 26 March 2021.
- "New Vintage 2021 Population Estimates Available for the Nation, States and Puerto Rico". New Vintage 2021 Population Estimates Available for the Nation, States and Puerto Rico. United States Census Bureau. 21 December 2021. Retrieved 10 April 2022.
{{cite web}}: CS1 maint: url-status (link)