Linlithgow (ward)
Linlithgow is one of the nine wards used to elect members of the West Lothian Council. It elects four Councillors. In 2019, the population of the ward was 16,499.[2]
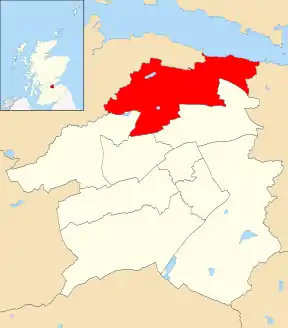
Location of the ward [1]
Councillors
| Election | Councillors | |||||
|---|---|---|---|---|---|---|
| 2007 | Martyn Day (SNP) |
Tom Conn (Labour) |
Tom Kerr (Conservative) | |||
| 2012 | ||||||
| 2017 | David Tait (SNP) | |||||
Election Results
2017 Election
2017 West Lothian Council election[3]
| Party | Candidate | FPv% | Count | |||||||
|---|---|---|---|---|---|---|---|---|---|---|
| 1 | 2 | 3 | 4 | 5 | 6 | 7 | ||||
| Conservative | Tom Kerr (incumbent) | 41.92% | 3,037 | |||||||
| Labour | Tom Conn (incumbent) | 14.63% | 1,060 | 1,425 | 1,450 | 1,558 | 1,956 | |||
| SNP | David Tait (incumbent) | 16.01% | 1,160 | 1,215 | 1,217 | 1,310 | 1,390 | 1,405 | 2,529 | |
| SNP | Sue Friel | 15.06% | 1,091 | 1,126 | 1,129 | 1,246 | 1,319 | 1,341 | ||
| Liberal Democrats | Sally Pattle | 5.26% | 381 | 692 | 714 | 872 | ||||
| Green | Maire McCormack | 6.57% | 476 | 535 | 541 | |||||
| UKIP | Alan Cooper | 0.55% | 40 | 113 | ||||||
| Electorate: TBC Valid: 7,245 Spoilt: 74 Quota: 1,812 Turnout: 59.0% | ||||||||||
2012 Election
2012 West Lothian Council election[5]
| Party | Candidate | FPv% | Count | |||||
|---|---|---|---|---|---|---|---|---|
| 1 | 2 | 3 | 4 | 5 | ||||
| Conservative | Tom Kerr (incumbent) | 33.18 | 2,112 | |||||
| SNP | Martyn Day (incumbent)†† | 28.70 | 1,827 | |||||
| Labour | Tom Conn (incumbent) | 20.30 | 1,292 | 1,453 | 1,478.7 | 1,483.2 | 1,627.9 | |
| SNP | David Tait | 13.02 | 829 | 920.3 | 1,101.4 | 1,106.9 | 1,186.9 | |
| Action to Save St John's Hospital | Cherie Finlay | 4.40 | 280 | 396.7 | 413.6 | 423.8 | ||
| National Front | Ernest Wilson | 0.39 | 25 | 30.2 | 30.6 | |||
| Electorate: 11,944 Valid: 6,365 Spoilt: 44 Quota: 1,592 Turnout: 6,409 (53.29%) | ||||||||
2007 Election
2007 West Lothian Council election
| Party | Candidate | 1st Pref | % | Seat | Count | |
|---|---|---|---|---|---|---|
| Conservative | Tom Kerr | 2,120 | 26.9 | 1 | 1 | |
| SNP | Martyn Day | 1,792 | 22.7 | 2 | 6 | |
| SNP | Tam Smith | 1,340 | 17.0 | |||
| Labour | Tom Conn | 1,328 | 16.9 | 3 | 6 | |
| Liberal Democrats | Geoff King | 739 | 9.4 | |||
| Green | Simon King-Spooner | 316 | 4.0 | |||
| Conservative | Sandy Pagan | 194 | 2.4 | |||
| Scottish Socialist | Eddy Cornock | 49 | 2.5 | |||
References
- "5th Reviews - ward maps | Scottish Boundary Commission". Lgbc-scotland.gov.uk. Retrieved 10 March 2020.
- "statistics.gov.scot/Linlithgow". Scottish Government. Retrieved 27 July 2021.
- https://www.westlothian.gov.uk/article/13871/Council-Election-results-2017
- "Archived copy". Archived from the original on 7 February 2019. Retrieved 11 March 2020.
{{cite web}}: CS1 maint: archived copy as title (link) - "Previous Election Results".
This article is issued from Wikipedia. The text is licensed under Creative Commons - Attribution - Sharealike. Additional terms may apply for the media files.