List of urban areas in the European Union
This is a list of urban areas in the European Union with over 500,000 inhabitants as of 2014. The data comes from Demographia and the United Nations Department of Economic and Social Affairs.[1][2][3] Demographia provides figures for urban areas (including conurbations),[2] while the UN DESA figures are for agglomerations only.[3] For comparison, Function Urban Area (FUA) population figures by Eurostat are also provided, however, these measure the wider metropolitan areas.
Important notes
- This is a list of urban areas, not a list of metropolitan areas. Urban areas are contiguous built-up areas where houses are typically not more than 200 m apart, not including rivers, parks, roads, industrial fields, etc. A metropolitan area is an urban area plus any satellite cities around it and any agricultural land in between. For instance Paris is sometimes listed with 12 million inhabitants, Stuttgart is frequently listed with 2.2 million inhabitants, Munich with 2 million or more, etc., indicating the wider metropolitan area of those places. Metropolitan areas, which imply much more complicated definitions (such as the proportion of people in satellite cities working in the core of the metropolitan area), can be accurately computed only by statistical offices, after they have chosen a definition for metropolitan areas, whereas urban areas can be computed by any institution or person with the study of maps, satellite imagery and other geographical data in order to determine the outer limits of a continuous built-up area with one or more neighbouring cities. Furthermore, the list does not make a difference between cities that have multiple satellites and cities that do not. Therefore, two cities with the same demographics for their urban area will have an equal ranking on this list, even if one of the two cities may be much larger as it is the core of a number of satellites.
- This is a list of urban areas, not a list of administrative cities. For example, the list of conurbations contains the urban area of Lille-Kortrijk. Lille and Kortrijk remain two very distinct cities, each belonging to a different country, culture and language area. For a list of the largest cities of the European Union by population, see List of cities in the European Union by population within city limits.
- The study of urban areas is useful to analyse how cities develop, which in turn can be used to define transportation, planning and environmental policies, to adjust administrative boundaries etc. At the same time its limitations have to be acknowledged. It is a purely geographic study and disregards all other factors that contribute to the analysis of the functional city. For instance, several cities in the European Union, such as Brussels, have reserved green belts in the outskirts which impacts the size of urban areas but not the "perceived city" as these green belts have now become integrated in what people consider to be the functional city.
Urban areas over 500,000 inhabitants (2015–2020)
| Rank | Urban area | Image | State | Population (urban areas; Demographia)[2] | ESPON Population (Functional Urban Area)[4] | Population (agglomerations; UN WUP)[3] | FUA population (metropolitan areas; Eurostat)[1] | Density (per km2; Demographia) |
Annual growth rate (%; Demographia) |
|---|---|---|---|---|---|---|---|---|---|
| 1 | Paris |  |
11,020,000 | 11,175,000 | 14,684,473[5] | 11,002,000 | 3,800 | 1.23[6] | |
| 2 | Ruhr (multiple cities) |  |
6,125,000 | 5,376,000 | N/A | 11,300,000 | 2,800 | 0.01 | |
| 3 | Madrid | 6,026,000 | 5,263,000 | 6,729,254 | 7,100,000 | 4,600 | 0.27 | ||
| 4 | Milan |  |
4,907,000 | 7,636,000 | 3,098,974 | 7,465,000 | 2,800 | −0.16 | |
| 5 | Barcelona | 4,588,000 | 4,082,000 | 5,658,319 | 5,900,000 | 4,300 | 0.12 | ||
| 6 | Berlin |  |
3,972,000 | 4,016,000 | 3,863,194 | n/a | 2,900 | 0.01 | |
| 7 | Naples | 3,574,000 | 3,714,000 | 2,201,789 | n/a | 3,600 | 0.01 | ||
| 8 | Athens |  |
3,325,000 | 3,761,000 | 3,051,899 | n/a | 5,000 | 0.29 | |
| 9 | Rome |  |
3,189,000 | 5,190,000 | 3,717,956 | n/a | 3,400 | 0.89 | |
| 10 | Lisbon | .jpg.webp) |
3,035,000 | 2,591,000 | 2,884,297 | n/a | 2,800 | 0.39 | |
| 11 | Rotterdam–The Hague | .jpg.webp) |
2,770,000 | 1,904,000 | N/A | n/a | 2,700 | 0.39 | |
| 12 | Budapest |  |
2,395,000 | 2,523,000 | 1,713,903 | 3,100,000 | 1,900 | −0.19 | |
| 13 | Cologne-Bonn | 2,085,000 | 3,070,000 | N/A | n/a | 2,300 | 0.50 | ||
| 14 | Brussels |  |
1,990,000 | 2,639,000 | 2,044,993 | n/a | 2,600 | 0.02[7] | |
| 15 | Hamburg |  |
1,976,000 | 2,983,000 | 1,830,673 | n/a | 2,700 | 0.43[7] | |
| 16 | Warsaw | 1,935,000 | 2,785,000 | 1,722,310 | 3,000,000 | 3,200 | 0.67 | ||
| 17 | Munich | 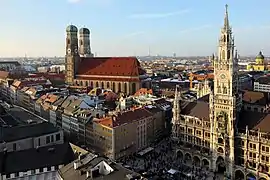 |
1,928,000 | 2,665,000 | 1,437,900 | n/a | 4,200 | 0.72[7] | |
| 18 | Frankfurt |  |
1,904,000 | 2,764,000 | n/a | n/a | 3,000 | 0.50 | |
| 19 | Bucharest |  |
1,870,000 | 2,064,000 | 1,867,724 | n/a | 6,500 | 0.10[7] | |
| 20 | Vienna |  |
1,809,000 | 2,584,000 | 1,752,845 | n/a | 3,900 | 1.04[7] | |
| 21 | Katowice (Katowice urban area) |  |
1,726,000 | 3,029,000 | N/A | n/a | 3,300 | 0.11 | |
| 22 | Sofia-Pernik |  |
1,646,636 | 3,174,000 | N/A | N/A | 5,700 | 0.78[7] | |
| 23 | Turin |  |
1,445,000 | 1,601,000 | 1,764,868 | n/a | 4,100 | −0.16[7] | |
| 24 | Stockholm | 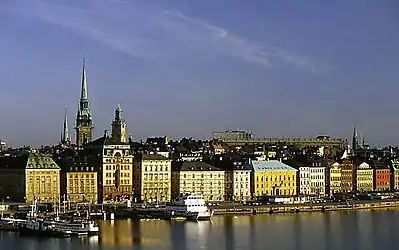 |
1,436,000 | 2,171,000 | 1,485,680 | n/a | 4,300 | 0.58[7] | |
| 25 | Lyon |  |
1,413,000 | 1,669,000 | 1,608,712 | n/a | 1,300 | 0.50[7] | |
| 26 | Valencia | 1,393,000 | 1,398,000 | n/a | 5,700 | 0.29[7] | |||
| 27 | Marseille |  |
1,330,000 | 1,530,000 | 1,605,046 | n/a | 3,100 | 0.46[7] | |
| 28 | Porto |  |
1,323,000 | 1,245,000 | 1,299,437 | n/a | 1,900 | ||
| 29 | Copenhagen | 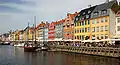 |
1,321,000 | 2,350,000 | 1,268,052 | 1,900,000 | 2,700 | 0.04[7] | |
| 30 | Dublin |  |
1,306,000 | 1,477,000 | 1,169,371 | n/a | 2,500 | 1.14[7] | |
| 31 | Stuttgart |  |
1,301,000 | 2,289,000 | n/a | 2,900 | |||
| 32 | Helsinki |  |
1,282,000 | 1,285,000 | 1,179,916 | 1,495,271 | 2,400 | 0.81[7] | |
| 33 | Lille |  |
1,270,000 | 1,379,000 | 1,027,178 | n/a | 2,200 | 0.50[7] | |
| 34 | Prague | 1,158,000 | 1,669,000 | 2,156,809 | 2,620,000 | 4,600 | −0.07[7] | ||
| 35 | Amsterdam |  |
1,140,000 | 2,497,000 | 1,090,772 | n/a | 3,200 | 0.41[7] | |
| 36 | Seville |  |
1,039,000 | 1,180,000 | n/a | 5,600 | |||
| 37 | Antwerp |  |
1,013,000 | 1,406,000 | n/a | 1,500 | 0.05[7] | ||
| 38 | Nice |  |
955,000 | 1,082,000 | n/a | 1,300 | 0.52[7] | ||
| 39 | Toulouse |  |
944,000 | 832,000 | n/a | 1,100 | 0.72[7] | ||
| 40 | Bergamo |  |
880,000 | 662,000 | n/a | 3,300 | |||
| 41 | Gdańsk (Tricity) | 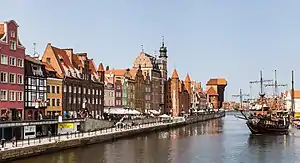 |
855,000 | 993,000 | n/a | 5,000 | |||
| 42 | Thessaloniki |  |
845,000 | 1,052,000 | n/a | 4,300 | 0.39[7] | ||
| 43 | Florence |  |
835,000 | 645,000 | n/a | 3,700 | |||
| 44 | Bordeaux |  |
823,000 | 918,000 | 1,244,264 | 700 | 0.60[7] | ||
| 45 | Bilbao |  |
765,000 | 947,000 | n/a | 5,800 | |||
| 46 | Kraków |  |
765,000 | 1,236,000 | 1,725,894 | n/a | 3,500 | ||
| 47 | Dresden |  |
765,000 | 882,000 | n/a | 2,200 | |||
| 48 | Zaragoza |  |
735,000 | 639,000 | n/a | 5,700 | |||
| 49 | Palermo | 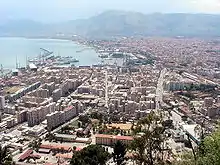 |
725,000 | 861,000 | n/a | 6,000 | 0.12[7] | ||
| 50 | Catania |  |
725,000 | 707,000 | n/a | 2,900 | |||
| 51 | Málaga |  |
720,000 | 944,000 | n/a | 3,600 | |||
| 52 | Utrecht |  |
715,000 | 692,000 | n/a | 3,900 | |||
| 53 | Hanover |  |
710,000 | 997,000 | n/a | 2,500 | |||
| 54 | Zagreb |  |
769,000 | 1,153,255 | n/a | 4,400 | |||
| 55 | Łódź | 670,000 | 1,165,000 | n/a | 5,000 | ||||
| 56 | Las Palmas | 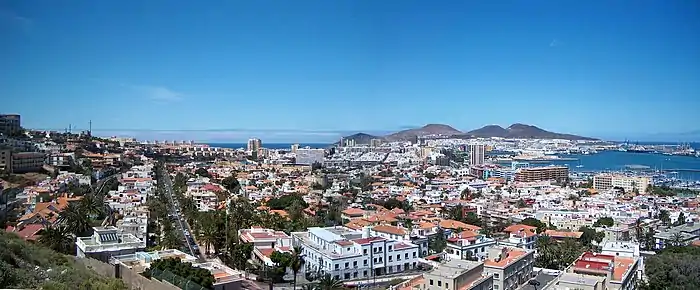 |
670,000 | 640,000 | n/a | 6,800 | |||
| 57 | Nuremberg |  |
665,000 | 1,443,000 | n/a | 3,000 | |||
| 58 | Bremen | .jpg.webp) |
645,000 | 1,077,000 | n/a | 2,400 | |||
| 59 | Wrocław | 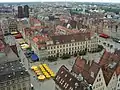 |
625,000 | 861,000 | n/a | 4,800 | |||
| 60 |
Leipzig |  |
625,000 | 842,000 | 1,037,782 | 2,000 | |||
| 61 | Mannheim |  |
625,000 | 683,000 | 1,184,343 | 3,500 | |||
| 62 | Padua |  |
620,000 | 549,000 | n/a | 3,200 | |||
| 63 | Gothenburg |  |
615,000 | 759,000 | n/a | 2,700 | |||
| 64 | Genoa |  |
610,000 | 694,000 | 1,500,000 | n/a | 7,900 | ||
| 65 | Riga | 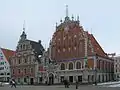 |
605,000 | 1,195,000 | n/a | 2,900 | |||
| 66 | Toulon | 580,000 | 518,000 | n/a | 700 | ||||
| 67 | Liège |  |
565,000 | 750,000 | n/a | 1,900 | |||
| 68 | Saarbrücken |  |
565,000 | 1,102,000 | n/a | 2,200 | |||
| 69 | Nantes | -_Nantes.jpg.webp) |
562,000 | 708,000 | n/a | 1,100 | |||
| 70 | Palma, Majorca |  |
560,000 | 433,000 | |||||
| 71 | Aachen |  |
545,000 | 672,000 | n/a | 1,500 | |||
| 72 | Santa Cruz de Tenerife |  |
540,000 | 399,000 | |||||
| 73 | Avignon |  |
530,267[8] | ||||||
| 74 | Bologna |  |
530,000 | 690,000 | |||||
| 75 | Grenoble |  |
530,000 | 555,000 | n/a | 985 | |||
| 76 | Poznań |  |
525,000 | 919,000 | n/a | 2,700 | |||
| 77 | Murcia |  |
525,000 | 504,000 | |||||
| 78 | Vilnius |  |
515,000 | 680,000 | 649,000 | n/a | 2,500 | ||
| 79 | Douai-Lens | .jpg.webp)  |
510,000 | 550,000 | n/a | 1,100 | |||
| 80 | Karlsruhe |  |
500,000 | 842,000 |
Other notable urban areas
| Urban area | Image | State | ESPON Population (Functional Urban Area)[4] | FUA population (metropolitan areas; Eurostat)[1] |
|---|---|---|---|---|
| Oviedo–Gijón–Avilés |  |
844,000 | ||
| Alicante-Elche-Elda |  |
793,000 | ||
| Granada | .jpg.webp) |
440,000 | ||
| Vigo metropolitan area | 413,000 | |||
| Cartagena |  |
409,000 | ||
| Cádiz |  |
400,000 | ||
| San Sebastián metropolitan area |  |
403,000* | (403,000) | |
| A Coruña |  |
376,000 | (408,00) | |
| Valladolid |  |
369,000 | (395,984) | |
| Córdoba | 325,000 | (360,000) | ||
| Tarragona–Reus |  |
325,000 | (423,360) | |
| Malmö |  |
658,050 | ||
| Tampere | 440,372 | |||
| Aarhus |  |
845,971 | ||
| Charleroi |  |
489,264 | ||
| Odense |  |
485,672 | ||
| Ostrava |  |
709,768 | ||
| Braunschweig | .JPG.webp) |
997,089 | ||
| Brno |  |
735,652 | ||
| Bari |  |
744,564 | ||
| Eindhoven | 761,702 | |||
| Rouen |  |
694,558 | ||
| Montpellier |  |
709,347 | ||
| Heidelberg |  |
707,346 | ||
| Lublin |  |
668,346 | ||
| Rennes |  |
684,304 | ||
| Augsburg |  |
675,285 | ||
| Kiel | 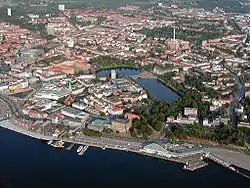 |
649,807[9] | ||
| Ghent | 399,741 | |||
| Catania |  |
656,989 |
Top 20 and top 30 urban areas by population
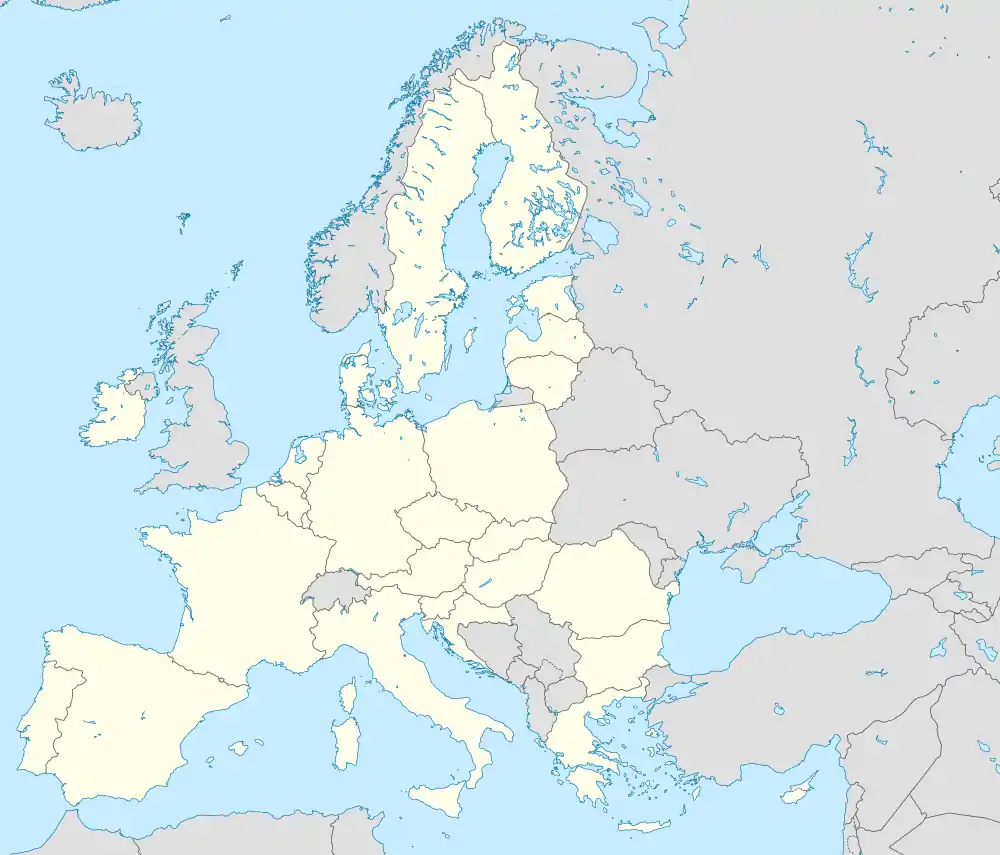
Location of the top 20 urban areas by population in the European Union.
See also
- List of cities in the European Union by population within city limits
- List of European cities by population within city limits
- List of urban areas in Europe
- List of metropolitan areas in Europe
- List of larger urban zones (metropolitan area)
- List of urban areas by population
- Blue Banana
- Golden Banana
References
- Eurostat: Cities (Urban Audit) Database. Retrieved 19 September 2016.
- Demographia: World Urban Areas. Retrieved 12 July 2017.
- Annual Population of Urban Agglomerations with 300,000 Inhabitants or More in 2014, by Country, 1950-2030 (thousands), World Urbanization Prospects, the 2014 revision Archived 18 February 2015 at the Wayback Machine, Population Division of the United Nations Department of Economic and Social Affairs. Retrieved 6 September 2015. Note: List based on estimates for 2015, from 2014.
- "ESPON Project 1.4.3 Study on Urban Functions" (PDF). 24 September 2015. Archived from the original (PDF) on 24 September 2015. Retrieved 21 June 2020.
- Aire urbaine de Paris (001), INSEE
- Aire urbaine de Paris (001), INSEE
- United Nations: World Urbanization Prospects Archived 10 March 2007 at archive.today
- "Villes et communes de France − Tableaux de l'économie française | Insee". www.insee.fr. Retrieved 2 March 2022.
- "Eurostat".
External links
- United Nations list of urban agglomerations in the European Union (as tabulated by INSEE).
- Population of urban areas provided by UK National Statistics for UK urban areas
- e-Geopolis: research group, university of Paris-Diderot, France - About world urbanization
| City proper | |
|---|---|
| Metropolitan area | |
| Urban area/agglomeration | |
| Historical | |
| Related articles | |
This article is issued from Wikipedia. The text is licensed under Creative Commons - Attribution - Sharealike. Additional terms may apply for the media files.