Jõhvi
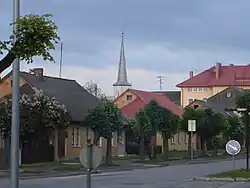
Jõhvi is a town in north-eastern Estonia, and the capital of Ida-Viru County. The town is also an administrative centre of Jõhvi Parish. It is situated 50 km from the Russian border.
Jõhvi | |
|---|---|
 | |
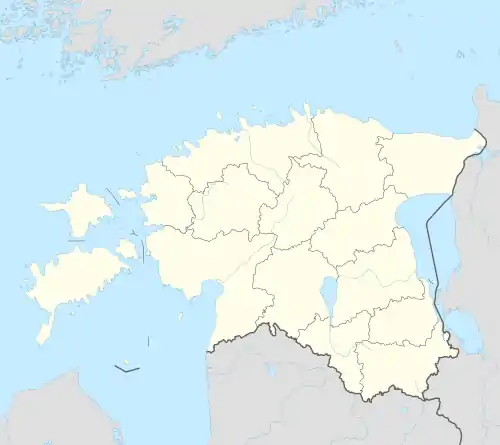 Jõhvi Location in Estonia | |
| Coordinates: 59°21′27″N 27°25′37″E | |
| Country | Estonia |
| County | Ida-Viru County |
| Municipality | Jõhvi Parish |
| City status | 1938 |
| Area | |
| • Total | 7.62 km2 (2.94 sq mi) |
| Population (2021)[1] | |
| • Total | 10,130 |
| • Rank | 13th |
| • Density | 1,300/km2 (3,400/sq mi) |
| Ethnicity | |
| • Estonians | 34.5% |
| • Russians | 55.7% |
| • other | 9.6% |
| Time zone | UTC+2 (EET) |
| • Summer (DST) | UTC+3 (EEST) |
| Postal code | 41501 to 41599 |
| Area code(s) | (+372) 33 |
Ethnic Estonians are a minority in Jõhvi, as about 55% of the town's population are ethnic Russians.
History
Jõhvi was first mentioned as a village in 1241 in Liber Census Daniae when it was ruled by Denmark. Historical names of Jõhvi were Gewi and Jewi. In the 13th century a church was built here and Jõhvi became the centre of the local church parish.
On 1 May 1938 Konstantin Päts renamed the Jõhvi borough a town along with nearly all Estonian boroughs. Up to 1991, Jõhvi was a district of Kohtla-Järve. In 2005 the town of Jõhvi was united with the parish of Jõhvi.
Climate
| Climate data for Jõhvi (normals 1991–2020, extremes 1926–present) | |||||||||||||
|---|---|---|---|---|---|---|---|---|---|---|---|---|---|
| Month | Jan | Feb | Mar | Apr | May | Jun | Jul | Aug | Sep | Oct | Nov | Dec | Year |
| Record high °C (°F) | 8.9 (48.0) |
8.1 (46.6) |
16.8 (62.2) |
26.0 (78.8) |
32.1 (89.8) |
33.1 (91.6) |
33.7 (92.7) |
34.6 (94.3) |
28.1 (82.6) |
19.7 (67.5) |
13.6 (56.5) |
10.9 (51.6) |
34.6 (94.3) |
| Average high °C (°F) | −2.3 (27.9) |
−2.4 (27.7) |
1.9 (35.4) |
9.5 (49.1) |
15.8 (60.4) |
19.6 (67.3) |
22.4 (72.3) |
21.0 (69.8) |
15.7 (60.3) |
8.5 (47.3) |
2.7 (36.9) |
−0.5 (31.1) |
9.3 (48.7) |
| Daily mean °C (°F) | −4.6 (23.7) |
−5.2 (22.6) |
−1.7 (28.9) |
4.5 (40.1) |
10.3 (50.5) |
14.6 (58.3) |
17.4 (63.3) |
15.9 (60.6) |
11.2 (52.2) |
5.5 (41.9) |
0.6 (33.1) |
−2.5 (27.5) |
5.5 (41.9) |
| Average low °C (°F) | −7.5 (18.5) |
−8.5 (16.7) |
−5.5 (22.1) |
−0.1 (31.8) |
4.3 (39.7) |
9.1 (48.4) |
11.9 (53.4) |
10.9 (51.6) |
7.0 (44.6) |
2.4 (36.3) |
−1.7 (28.9) |
−5 (23) |
1.4 (34.5) |
| Record low °C (°F) | −34.5 (−30.1) |
−36 (−33) |
−28.4 (−19.1) |
−18 (0) |
−6.5 (20.3) |
−2.5 (27.5) |
1.7 (35.1) |
−0.6 (30.9) |
−4.2 (24.4) |
−15.7 (3.7) |
−25.9 (−14.6) |
−41 (−42) |
−41 (−42) |
| Average precipitation mm (inches) | 45 (1.8) |
34 (1.3) |
36 (1.4) |
34 (1.3) |
50 (2.0) |
84 (3.3) |
77 (3.0) |
93 (3.7) |
67 (2.6) |
84 (3.3) |
64 (2.5) |
49 (1.9) |
717 (28.2) |
| Average precipitation days (≥ 1.0 mm) | 12 | 9 | 9 | 8 | 7 | 10 | 11 | 12 | 13 | 14 | 14 | 14 | 132 |
| Average relative humidity (%) | 90 | 88 | 80 | 72 | 68 | 73 | 76 | 80 | 84 | 87 | 90 | 91 | 82 |
| Source: Estonian Weather Service (precipitation days, 1971–2000)[2][3][4][5][6] | |||||||||||||
Gallery
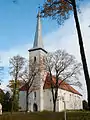 Jõhvi church
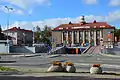 Central square
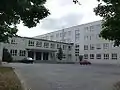 Jõhvi Gymnasium
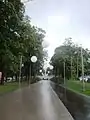 Jõhvi promenade
 Jõhvi Concert Hall
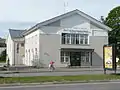 Jõhvi Central Library
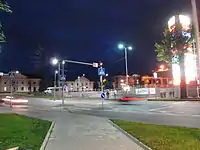 Jõhvi at night
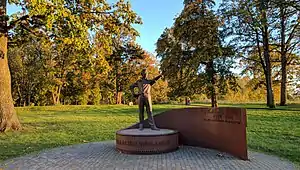 Monument in memoriam of Kaljo Kiisk
References
- "Population by sex, age group and place of residence after the 2017 administrative reform, 1 January". Statistics Estonia. Retrieved 2021-12-26.
- "Climate normals-Temperature". Estonian Weather Service. Retrieved 14 February 2021.
- "Climate normals-Precipitation". Estonian Weather Service. Retrieved 14 February 2021.
- "Climate normals-Humidity". Estonian Weather Service. Retrieved 14 February 2021.
- "Kliimanormid-Sademed, õhuniiskus" (in Estonian). Estonian Weather Service. Archived from the original on 22 February 2012. Retrieved 14 February 2021.
- "Rekordid" (in Estonian). Estonian Weather Service. Retrieved 19 March 2021.
External links
| Wikivoyage has a travel guide for Jõhvi. |
| Wikimedia Commons has media related to Jõhvi. |
| ||
Jaanilinn (Ivangorod) and Petseri (Pechory) were annexed by the Soviet Union in 1945 and are currently part of Russia. | ||
| Town |  | |
|---|---|---|
| Small borough | ||
| Villages | ||
This article is issued from Wikipedia. The text is licensed under Creative Commons - Attribution - Sharealike. Additional terms may apply for the media files.