Hudiksvall Municipality
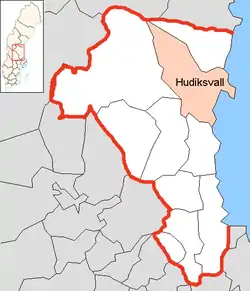
Hudiksvall Municipality (Hudiksvalls kommun) is one of Sweden's 290 municipalities, situated in Gävleborg County, east central Sweden. Its seat is in the city Hudiksvall.
Hudiksvall Municipality
Hudiksvalls kommun | |
|---|---|
 Hudiksvalls Train Station | |
 Coat of arms | |
 | |
| Coordinates: 61°44′N 17°07′E | |
| Country | Sweden |
| County | Gävleborg County |
| Seat | Hudiksvall |
| Area | |
| • Total | 4,516.62 km2 (1,743.88 sq mi) |
| • Land | 2,488.89 km2 (960.97 sq mi) |
| • Water | 2,027.73 km2 (782.91 sq mi) |
| Area as of 1 January 2014. | |
| Population (31 December 2021)[2] | |
| • Total | 37,744 |
| • Density | 8.4/km2 (22/sq mi) |
| Time zone | UTC+1 (CET) |
| • Summer (DST) | UTC+2 (CEST) |
| ISO 3166 code | SE |
| Province | Hälsingland |
| Municipal code | 2184 |
| Website | www.hudiksvall.se |
The present municipality was formed in 1971 when the City of Hudiksvall was amalgamated with four surrounding rural municipalities. Minor amalgamations had also taken place in 1952 and 1965, reducing the number of local government entities in the area.
Geography
Distance to large towns: Stockholm 305 kilometres (190 mi), Gävle 130 kilometres (81 mi), Sundsvall 84 kilometres (52 mi).
Localities
Figures as of 2000, from Statistics Sweden
- Hudiksvall 15 325 (2002)
- Iggesund, 3444
- Delsbo, 2284
- Enånger, 724
- Friggesund, 599
- Sörforsa, 1540
Climate
| Climate data for Hudiksvall (2002–2021 averages); extremes since 1934 | |||||||||||||
|---|---|---|---|---|---|---|---|---|---|---|---|---|---|
| Month | Jan | Feb | Mar | Apr | May | Jun | Jul | Aug | Sep | Oct | Nov | Dec | Year |
| Record high °C (°F) | 12.0 (53.6) |
13.5 (56.3) |
17.8 (64.0) |
24.3 (75.7) |
30.3 (86.5) |
31.4 (88.5) |
34.0 (93.2) |
32.5 (90.5) |
26.7 (80.1) |
20.9 (69.6) |
17.6 (63.7) |
12.3 (54.1) |
34.0 (93.2) |
| Mean maximum °C (°F) | 6.0 (42.8) |
8.1 (46.6) |
13.8 (56.8) |
18.7 (65.7) |
23.4 (74.1) |
27.2 (81.0) |
28.8 (83.8) |
27.4 (81.3) |
22.9 (73.2) |
16.4 (61.5) |
11.2 (52.2) |
6.9 (44.4) |
29.8 (85.6) |
| Average high °C (°F) | −0.8 (30.6) |
0.5 (32.9) |
5.0 (41.0) |
10.3 (50.5) |
14.9 (58.8) |
19.6 (67.3) |
22.5 (72.5) |
21.0 (69.8) |
16.5 (61.7) |
9.7 (49.5) |
4.1 (39.4) |
1.0 (33.8) |
10.4 (50.7) |
| Daily mean °C (°F) | −4.1 (24.6) |
−3.3 (26.1) |
0.5 (32.9) |
4.9 (40.8) |
9.5 (49.1) |
14.2 (57.6) |
17.3 (63.1) |
16.0 (60.8) |
11.7 (53.1) |
5.8 (42.4) |
1.2 (34.2) |
−2.1 (28.2) |
6.0 (42.7) |
| Average low °C (°F) | −7.3 (18.9) |
−7.0 (19.4) |
−4.2 (24.4) |
−0.6 (30.9) |
4.1 (39.4) |
8.7 (47.7) |
12.1 (53.8) |
11.0 (51.8) |
6.9 (44.4) |
1.8 (35.2) |
−1.6 (29.1) |
−5.0 (23.0) |
1.6 (34.8) |
| Mean minimum °C (°F) | −18.4 (−1.1) |
−18.7 (−1.7) |
−13.7 (7.3) |
−6.9 (19.6) |
−2.7 (27.1) |
2.8 (37.0) |
6.0 (42.8) |
4.4 (39.9) |
−0.1 (31.8) |
−5.8 (21.6) |
−9.5 (14.9) |
−14.9 (5.2) |
−22.0 (−7.6) |
| Record low °C (°F) | −29.1 (−20.4) |
−32.0 (−25.6) |
−26.3 (−15.3) |
−19.0 (−2.2) |
−7.6 (18.3) |
−1.4 (29.5) |
1.9 (35.4) |
0.6 (33.1) |
−3.7 (25.3) |
−13.5 (7.7) |
−18.8 (−1.8) |
−25.6 (−14.1) |
−32.0 (−25.6) |
| Average precipitation mm (inches) | 57.8 (2.28) |
39.2 (1.54) |
35.1 (1.38) |
29.4 (1.16) |
42.5 (1.67) |
61.7 (2.43) |
71.1 (2.80) |
82.2 (3.24) |
46.1 (1.81) |
66.3 (2.61) |
55.5 (2.19) |
67.2 (2.65) |
654.1 (25.76) |
| Average extreme snow depth cm (inches) | 37 (15) |
44 (17) |
36 (14) |
11 (4.3) |
0 (0) |
0 (0) |
0 (0) |
0 (0) |
0 (0) |
2 (0.8) |
12 (4.7) |
23 (9.1) |
52 (20) |
| Source 1: SMHI Open Data[3] | |||||||||||||
| Source 2: SMHI climate data 2002–2021[4] | |||||||||||||
| Climate data for Delsbo (2002–2021 averages); extremes since 1901 | |||||||||||||
|---|---|---|---|---|---|---|---|---|---|---|---|---|---|
| Month | Jan | Feb | Mar | Apr | May | Jun | Jul | Aug | Sep | Oct | Nov | Dec | Year |
| Record high °C (°F) | 11.0 (51.8) |
13.0 (55.4) |
16.7 (62.1) |
25.4 (77.7) |
28.8 (83.8) |
32.8 (91.0) |
33.6 (92.5) |
33.0 (91.4) |
26.6 (79.9) |
21.8 (71.2) |
15.9 (60.6) |
11.9 (53.4) |
33.6 (92.5) |
| Mean maximum °C (°F) | 5.6 (42.1) |
7.0 (44.6) |
12.2 (54.0) |
19.2 (66.6) |
24.0 (75.2) |
27.0 (80.6) |
28.6 (83.5) |
26.8 (80.2) |
22.1 (71.8) |
15.5 (59.9) |
10.7 (51.3) |
6.9 (44.4) |
29.8 (85.6) |
| Average high °C (°F) | −1.9 (28.6) |
−0.7 (30.7) |
4.0 (39.2) |
10.6 (51.1) |
15.3 (59.5) |
19.8 (67.6) |
22.5 (72.5) |
20.7 (69.3) |
15.9 (60.6) |
8.8 (47.8) |
3.3 (37.9) |
0.0 (32.0) |
9.9 (49.7) |
| Daily mean °C (°F) | −5.7 (21.7) |
−4.7 (23.5) |
−0.8 (30.6) |
4.6 (40.3) |
9.4 (48.9) |
13.9 (57.0) |
16.7 (62.1) |
15.3 (59.5) |
11.0 (51.8) |
5.0 (41.0) |
0.3 (32.5) |
−3.4 (25.9) |
5.1 (41.2) |
| Average low °C (°F) | −9.5 (14.9) |
−8.7 (16.3) |
−5.6 (21.9) |
−1.5 (29.3) |
3.4 (38.1) |
8.0 (46.4) |
10.9 (51.6) |
9.8 (49.6) |
6.0 (42.8) |
1.2 (34.2) |
−2.8 (27.0) |
−6.8 (19.8) |
0.4 (32.7) |
| Mean minimum °C (°F) | −22.1 (−7.8) |
−21.2 (−6.2) |
−17.2 (1.0) |
−8.3 (17.1) |
−3.6 (25.5) |
1.9 (35.4) |
5.0 (41.0) |
3.0 (37.4) |
−1.5 (29.3) |
−6.5 (20.3) |
−11.5 (11.3) |
−17.6 (0.3) |
−25.2 (−13.4) |
| Record low °C (°F) | −35.6 (−32.1) |
−35.9 (−32.6) |
−31.9 (−25.4) |
−21.2 (−6.2) |
−8.5 (16.7) |
−2.6 (27.3) |
1.3 (34.3) |
−2.0 (28.4) |
−8.2 (17.2) |
−15.0 (5.0) |
−23.5 (−10.3) |
−33.2 (−27.8) |
−35.9 (−32.6) |
| Average precipitation mm (inches) | 34.4 (1.35) |
22.6 (0.89) |
22.8 (0.90) |
20.2 (0.80) |
41.4 (1.63) |
61.1 (2.41) |
66.5 (2.62) |
72.5 (2.85) |
41.1 (1.62) |
50.2 (1.98) |
37.2 (1.46) |
37.8 (1.49) |
507.8 (20) |
| Source 1: SMHI[5] | |||||||||||||
| Source 2: SMHI climate data 2002–2021[6] | |||||||||||||
| Climate data for Kuggören, on the open Bothnian Sea (2002–2021 averages); extremes 1970–1987 & since 1996 | |||||||||||||
|---|---|---|---|---|---|---|---|---|---|---|---|---|---|
| Month | Jan | Feb | Mar | Apr | May | Jun | Jul | Aug | Sep | Oct | Nov | Dec | Year |
| Record high °C (°F) | 10.4 (50.7) |
10.9 (51.6) |
16.4 (61.5) |
21.7 (71.1) |
24.8 (76.6) |
29.6 (85.3) |
31.2 (88.2) |
30.1 (86.2) |
25.3 (77.5) |
20.0 (68.0) |
16.0 (60.8) |
12.1 (53.8) |
31.2 (88.2) |
| Mean maximum °C (°F) | 6.4 (43.5) |
7.3 (45.1) |
11.8 (53.2) |
15.5 (59.9) |
19.2 (66.6) |
23.7 (74.7) |
25.3 (77.5) |
24.4 (75.9) |
21.0 (69.8) |
14.6 (58.3) |
10.5 (50.9) |
7.3 (45.1) |
26.5 (79.7) |
| Average high °C (°F) | 0.4 (32.7) |
0.7 (33.3) |
3.6 (38.5) |
7.2 (45.0) |
11.2 (52.2) |
16.3 (61.3) |
19.6 (67.3) |
18.9 (66.0) |
15.0 (59.0) |
8.9 (48.0) |
4.7 (40.5) |
2.3 (36.1) |
9.1 (48.3) |
| Daily mean °C (°F) | −1.9 (28.6) |
−1.7 (28.9) |
0.8 (33.4) |
4.2 (39.6) |
8.2 (46.8) |
13.2 (55.8) |
16.7 (62.1) |
16.2 (61.2) |
12.2 (54.0) |
6.7 (44.1) |
2.7 (36.9) |
0.0 (32.0) |
6.4 (43.6) |
| Average low °C (°F) | −4.2 (24.4) |
−4.1 (24.6) |
−2.1 (28.2) |
1.1 (34.0) |
5.2 (41.4) |
10.1 (50.2) |
13.8 (56.8) |
13.4 (56.1) |
9.4 (48.9) |
4.5 (40.1) |
0.7 (33.3) |
−2.3 (27.9) |
3.8 (38.8) |
| Mean minimum °C (°F) | −12.7 (9.1) |
−12.8 (9.0) |
−9.0 (15.8) |
−3.1 (26.4) |
1.0 (33.8) |
6.3 (43.3) |
10.0 (50.0) |
8.9 (48.0) |
4.5 (40.1) |
−1.6 (29.1) |
−5.9 (21.4) |
−9.4 (15.1) |
−15.9 (3.4) |
| Record low °C (°F) | −28.1 (−18.6) |
−26.6 (−15.9) |
−22.2 (−8.0) |
−10.0 (14.0) |
−3.1 (26.4) |
1.8 (35.2) |
6.6 (43.9) |
5.9 (42.6) |
−1.2 (29.8) |
−8.2 (17.2) |
−12.8 (9.0) |
−24.6 (−12.3) |
−28.1 (−18.6) |
| Average precipitation mm (inches) | 29.5 (1.16) |
16.9 (0.67) |
18.1 (0.71) |
21.4 (0.84) |
36.2 (1.43) |
49.4 (1.94) |
47.8 (1.88) |
69.9 (2.75) |
41.0 (1.61) |
59.1 (2.33) |
42.7 (1.68) |
43.0 (1.69) |
475 (18.69) |
| Source 1: SMHI Open Data[7] | |||||||||||||
| Source 2: SMHI Open Data[8] | |||||||||||||
Economy
The largest employer is the municipality and the county council, where around 38% of the work force have its work place.
The largest private employer is the paper product company Holmen where about 10% of the work force work.
In the old history, the industry was dominated by fishing. In the 19th century the forest industry came to dominate, further enhanced by the improved transportations which the rail roads provided in the second half of that century. Although in decline during the 20th century, half of the municipal industry is still based around forest industry.
Employees per sectors:
- Pulp, paper, and paper goods: 29%
- Machine technical industry: 20%
- Electronics 19%
- Metal products: 8%
- Wood products 7%.
The electronics industry is dominated by Ericsson Network Technologies making optical and copper wires for telecommunication systems. (Sources: ,Holmen.com)
Transportation
Hudiksvall is accessible via the European route E4 highway, and the East Coast Railway (Ostkustbanan).[9]
References
- "Statistiska centralbyrån, Kommunarealer den 1 januari 2014" (in Swedish). Statistics Sweden. 2014-01-01. Archived from the original (Microsoft Excel) on 2016-09-27. Retrieved 2014-04-18.
- "Folkmängd i riket, län och kommuner 31 december 2021" (in Swedish). Statistics Sweden. February 22, 2022. Retrieved February 22, 2022.
- "SMHI Open Data precipitation for Hudiksvall" (in Swedish). Swedish Meteorological and Hydrological Institute.
- "SMHI Monthly Data 2002–2021". SMHI. 23 December 2021.
- "Nederbörd Delsbo A" (in Swedish). SMHI.
- "SMHI climate data 2002–2021" (in Swedish). SMHI. 23 December 2021.
- "SMHI Open Data precipitation for Kuggören A" (in Swedish). Swedish Meteorological and Hydrological Institute.
- "SMHI Open data temperature for Kuggören A" (in Swedish). SMHI. 13 January 2022.
- Page____1271.aspx
External links
| Wikimedia Commons has media related to Hudiksvall Municipality. |
- Hudiksvall - Official site
Places adjacent to Hudiksvall Municipality | ||||||||||||||||
|---|---|---|---|---|---|---|---|---|---|---|---|---|---|---|---|---|
| ||||||||||||||||
Municipalities and seats of Gävleborg County | ||
|---|---|---|
| Municipalities | ||
| Municipal seats | ||