Hamilton Mountain
Hamilton Mountain is a federal electoral district in Ontario, Canada, that has been represented in the House of Commons of Canada since 1968. The riding is located in the Hamilton region.
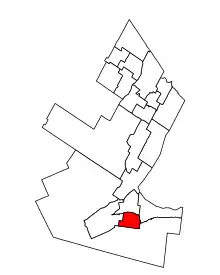 Hamilton Mountain in relation to the other Hamilton area ridings | |||
| Federal electoral district | |||
| Legislature | House of Commons | ||
| MP |
Liberal | ||
| District created | 1966 | ||
| First contested | 1968 | ||
| Last contested | 2021 | ||
| District webpage | profile, map | ||
| Demographics | |||
| Population (2011)[1] | 103,615 | ||
| Electors (2015) | 76,886 | ||
| Area (km²)[1] | 35 | ||
| Pop. density (per km²) | 2,960.4 | ||
| Census division(s) | Hamilton | ||
| Census subdivision(s) | Hamilton | ||
The socio-economic composition of the Hamilton Mountain is diverse, with low-income public housing residents as well as million-dollar estates, highly-paid unionized workers, low-wage unskilled workers, and well-established families and recent immigrants.
That diversity makes Hamilton Mountain a swing riding in which many elections are virtually two-way or three-way ties. For instance, fewer than 100 votes separated the top two places in 1988. Only 3000 votes separated the top three candidates in 2004. From the 1990s to 2006, the races were between the Liberals and the NDP. After the Liberal Party's collapse in the late 2000s, the Conservatives became the main competitors in the riding. With the Liberal resurgence during the 2015 election, the vote difference between the three major parties have narrowed, solidifying the riding's status as a three-way tossup.
Geography
In the 2012 redistribution, Hamilton Mountain lost area to Hamilton West-Ancaster-Dundas and Flamborough—Glanbrook. The riding was redefined to:
that part of the City of Hamilton commencing at the intersection of the Niagara Escarpment with Redhill Creek, west along said creek to Mountain Brow Boulevard, south along said boulevard to Arbour Road, then generally southerly along said road, its intermittent production, Anchor Road and its southerly production to the intersection of Rymal Road East with Glover Road, then westerly along Rymal Road East and West to Garth Street, north along said street to the Lincoln M. Alexander Parkway, east along said parkway to West 5th Street, north along said street to James Mountain Road, then generally northeasterly along said road to the Niagara Escarpment, then east and south along said escarpment to the point of commencement.[2][3]
History
The riding was created in 1966 from parts of Ancaster—Dundas—Flamborough—Aldershot, Hamilton South, Hamilton West, Stoney Creek, and Wentworth ridings.
It consisted initially of:
- the part of the City of Hamilton east of a line drawn west along Mud Street, north along Mountain Brow Boulevard, and northwest along the brow of the Mountain; and
- the part of the Township of Glanford in the County of Wentworth lying north of County Suburban Road No. 22.
In 1976, it was redefined to consist of the part of the City of Hamilton lying south of the brow of the Mountain bounded on the east by Red Hill Creek, on the west by the west limit of the city, and on the south by Mohawk Road, Limeridge Road, and Mountain Brow Boulevard.
In 1987, it was redefined to consist of the part of the City of Hamilton lying south of the brow of the Mountain bounded by a line drawn from Mountain Brow Boulevard, west along Limeridge Road to St. Jerome School, west to Garth Street, south along Garth Street, west along the proposed Mountain Freeway.
In 1996, it was redefined to consist of the part of the City of Hamilton south of a line drawn north from the western city limit near Lisajane Court, east along Stone Church Road, north along Garth Street, east along Redhill Creek Expressway, north along West 5 Street, then east along the brow of the Niagara Escarpment to the eastern city limit.
In 2003, the riding was redefined to consist of the part of the City of Hamilton bounded by a line drawn west from the Niagara Escarpment along Red Hill Valley Parkway|Red Hill Creek, south along Mountain Brow Boulevard, Arbour Road and Glover Road, west along the hydroelectric transmission line situated south of Rymal Road East, north along Glancaster Road, east along Garner Road East, north along the hydroelectric transmission line situated west of Upper Paradise Road, east along Lincoln M. Alexander Parkway, north along West 5th Street, northeast along James Mountain Road, and east and south along the Niagara Escarpment to the point of commencement.
Members of Parliament
This riding has elected the following Members of Parliament:
| Parliament | Years | Member | Party | |
|---|---|---|---|---|
| Hamilton Mountain Riding created from Hamilton South and Hamilton West |
||||
| 28th | 1968–1972 | Gordon J. Sullivan | Liberal | |
| 29th | 1972–1974 | Duncan Beattie | Progressive Conservative | |
| 30th | 1974–1979 | Gus MacFarlane | Liberal | |
| 31st | 1979–1980 | Duncan Beattie | Progressive Conservative | |
| 32nd | 1980–1984 | Ian Deans | New Democratic | |
| 33rd | 1984–1986 | |||
| 1987–1988 | Marion Dewar | |||
| 34th | 1988–1993 | Beth Phinney | Liberal | |
| 35th | 1993–1997 | |||
| 36th | 1997–2000 | |||
| 37th | 2000–2004 | |||
| 38th | 2004–2006 | |||
| 39th | 2006–2008 | Chris Charlton | New Democratic | |
| 40th | 2008–2011 | |||
| 41st | 2011–2015 | |||
| 42nd | 2015–2019 | Scott Duvall | ||
| 43rd | 2019–2021 | |||
| 44th | 2021–present | Lisa Hepfner | Liberal | |
Election results
| 2021 Canadian federal election | ||||||||
|---|---|---|---|---|---|---|---|---|
| Party | Candidate | Votes | % | ±% | Expenditures | |||
| Liberal | Lisa Hepfner | 16,547 | 34.1 | +3.8 | ||||
| New Democratic | Malcolm Allen | 15,712 | 32.4 | -3.7 | ||||
| Conservative | Al Miles | 11,838 | 24.4 | -1.1 | ||||
| People's | Chelsey Taylor | 3,097 | 6.4 | +5.0 | ||||
| Green | Dave Urquhart | 974 | 2.0 | -3.9 | ||||
| Christian Heritage | Jim Enos | 336 | 0.7 | +0.1 | ||||
| Total valid votes | 48,460 | 99.1 | ||||||
| Total rejected ballots | 419 | 0.9 | ||||||
| Turnout | 48,879 | 60.6 | ||||||
| Eligible voters | 80,647 | |||||||
| Liberal gain from New Democratic | Swing | +3.8 | ||||||
| Source: Elections Canada[4] | ||||||||
| 2019 Canadian federal election | ||||||||
|---|---|---|---|---|---|---|---|---|
| Party | Candidate | Votes | % | ±% | Expenditures | |||
| New Democratic | Scott Duvall | 19,135 | 36.1 | +0.21 | $49,075.51 | |||
| Liberal | Bruno Uggenti | 16,057 | 30.3 | -3.22 | $69,313.38 | |||
| Conservative | Peter Dyakowski | 13,443 | 25.5 | -0.20 | $95,613.48 | |||
| Green | Dave Urquhart | 3,115 | 5.9 | +3.31 | none listed | |||
| People's | Trevor Lee | 760 | 1.44 | - | $668.87 | |||
| Christian Heritage | Jim Enos | 330 | 0.6 | -0.24 | none listed | |||
| Rhinoceros | Richard Plett | 109 | 0.2 | - | none listed | |||
| Total valid votes/expense limit | 52,949 | 100.0 | ||||||
| Total rejected ballots | 489 | |||||||
| Turnout | 53,438 | 66.0 | ||||||
| Eligible voters | 80,992 | |||||||
| New Democratic hold | Swing | +1.72 | ||||||
| Source: Elections Canada[5][6] | ||||||||
| 2015 Canadian federal election | ||||||||
|---|---|---|---|---|---|---|---|---|
| Party | Candidate | Votes | % | ±% | Expenditures | |||
| New Democratic | Scott Duvall | 18,146 | 35.89 | -12.55 | $57,552.86 | |||
| Liberal | Shaun Burt | 16,933 | 33.49 | +17.85 | $45,580.19 | |||
| Conservative | Al Miles | 12,991 | 25.70 | -6.59 | $34,537.26 | |||
| Green | Raheem Aman | 1,283 | 2.54 | -0.29 | $226.00 | |||
| Libertarian | Andrew James Caton | 763 | 1.51 | – | – | |||
| Christian Heritage | Jim Enos | 438 | 0.87 | $5,372.31 | ||||
| Total valid votes/Expense limit | 50,554 | 100.00 | $209,945.37 | |||||
| Total rejected ballots | 307 | 0.60 | – | |||||
| Turnout | 50,861 | 65.15 | ||||||
| Eligible voters | 76,886 | |||||||
| New Democratic hold | Swing | -15.20 | ||||||
| Source: Elections Canada[7][8] | ||||||||
| 2011 federal election redistributed results[9] | |||
|---|---|---|---|
| Party | Vote | % | |
| New Democratic | 21,806 | 48.45 | |
| Conservative | 14,534 | 32.29 | |
| Liberal | 7,040 | 15.64 | |
| Green | 1,271 | 2.82 | |
| Others | 358 | 0.80 | |
| 2011 Canadian federal election | ||||||||
|---|---|---|---|---|---|---|---|---|
| Party | Candidate | Votes | % | ±% | Expenditures | |||
| New Democratic | Chris Charlton | 25,595 | 47.2 | +3.5 | ||||
| Conservative | Terry Anderson | 17,936 | 33.1 | +2.4 | ||||
| Liberal | Marie Bountrogianni | 8,787 | 16.2 | -4.0 | ||||
| Green | Stephen Brotherson | 1,505 | 2.8 | -2.7 | ||||
| Christian Heritage | Jim Enos | 270 | 0.5 | – | ||||
| Independent | Henryk Adamiec | 171 | 0.3 | – | ||||
| Total valid votes | 54,264 | 100.0 | ||||||
| Total rejected ballots | 261 | 0.5 | +0.4 | |||||
| Turnout | 54,525 | 61.8 | – | |||||
| Eligible voters | 88,196 | – | – | |||||
| Source: Elections Canada.[10] | ||||||||
| 2008 Canadian federal election | ||||||||
|---|---|---|---|---|---|---|---|---|
| Party | Candidate | Votes | % | ±% | Expenditures | |||
| New Democratic | Chris Charlton | 22,796 | 43.7 | +6.3 | $79,793 | |||
| Conservative | Terry Anderson | 16,010 | 30.7 | +3.5 | $58,663 | |||
| Liberal | Tyler Banham | 10,531 | 20.2 | -11.7 | $78,883 | |||
| Green | Stephen Brotherston | 2,884 | 5.5 | +2.9 | $7,683 | |||
| Total valid votes/Expense limit | 52,221 | 100.0 | $91,117 | |||||
| Total rejected ballots | 293 | 0.1 | ||||||
| Turnout | 52,514 | |||||||
| Source: Elections Canada.[10] | ||||||||
| 2006 Canadian federal election | ||||||||
|---|---|---|---|---|---|---|---|---|
| Party | Candidate | Votes | % | ±% | ||||
| New Democratic | Chris Charlton | 21,869 | 37.3 | +4.4 | ||||
| Liberal | Bill Kelly | 18,697 | 31.9 | -2.9 | ||||
| Conservative | Don Graves | 15,915 | 27.2 | -2.1 | ||||
| Green | Susan Wadsworth | 1,510 | 2.6 | 0.0 | ||||
| Christian Heritage | Stephen Downey | 458 | 0.8 | |||||
| Marxist–Leninist | Paul Lane | 131 | 0.2 | -0.2 | ||||
| Total valid votes | 58,580 | 100.0 | ||||||
| Source: Elections Canada.[10] | ||||||||
| 2004 Canadian federal election | ||||||||
|---|---|---|---|---|---|---|---|---|
| Party | Candidate | Votes | % | ±% | ||||
| Liberal | Beth Phinney | 18,548 | 34.8 | -16.1 | ||||
| New Democratic | Chris Charlton | 17,552 | 32.9 | +23.0 | ||||
| Conservative | Tom Jackson | 15,590 | 29.3 | -9.3 | ||||
| Green | Jo Pavlov | 1,378 | 2.6 | |||||
| Marxist–Leninist | Paul Lane | 214 | 0.4 | -0.2 | ||||
| Total valid votes | 53,282 | 100.0 | ||||||
| Source: Elections Canada.[10] | ||||||||
Note: Conservative vote is compared to the total of the Canadian Alliance vote and Progressive Conservative vote in 2000 election.
| 2000 Canadian federal election | ||||||||
|---|---|---|---|---|---|---|---|---|
| Party | Candidate | Votes | % | ±% | ||||
| Liberal | Beth Phinney | 22,536 | 50.9 | +5.1 | ||||
| Alliance | Mike Scott | 9,621 | 21.7 | +4.1 | ||||
| Progressive Conservative | John Smith | 7,467 | 16.9 | -2.4 | ||||
| New Democratic | James Stephenson | 4,387 | 9.9 | -6.2 | ||||
| Marxist–Leninist | Rolf Gerstenberger | 259 | 0.6 | +0.3 | ||||
| Total valid votes | 44,270 | 100.0 | ||||||
Note: Canadian Alliance vote is compared to the Reform vote in 1997 election.
| 1997 Canadian federal election | ||||||||
|---|---|---|---|---|---|---|---|---|
| Party | Candidate | Votes | % | ±% | ||||
| Liberal | Beth Phinney | 21,128 | 45.8 | -11.3 | ||||
| Progressive Conservative | John Smith | 8,877 | 19.2 | +7.8 | ||||
| Reform | Richard F. Gaasenbeek | 8,154 | 17.7 | -3.9 | ||||
| New Democratic | Chris Charlton | 7,440 | 16.1 | 8.4 | ||||
| Canadian Action | Christopher M. Patty | 374 | 0.8 | |||||
| Marxist–Leninist | Iqbal Sumbal | 146 | 0.3 | |||||
| Total valid votes | 46,119 | 100.0 | ||||||
| 1993 Canadian federal election | ||||||||
|---|---|---|---|---|---|---|---|---|
| Party | Candidate | Votes | % | ±% | ||||
| Liberal | Beth Phinney | 27,218 | 57.1 | +24.2 | ||||
| Reform | Craig Chandler | 10,297 | 21.6 | |||||
| Progressive Conservative | Tamra Mann | 5,474 | 11.5 | -19.0 | ||||
| New Democratic | Andrew MacKenzie | 3,670 | 7.7 | -25.1 | ||||
| National | Gunter Hinz | 673 | 1.4 | |||||
| Natural Law | Isabel Millman | 331 | 0.7 | |||||
| Total valid votes | 47,663 | 100.0 | ||||||
| 1988 Canadian federal election | ||||||||
|---|---|---|---|---|---|---|---|---|
| Party | Candidate | Votes | % | ±% | ||||
| Liberal | Beth Phinney | 16,934 | 32.9 | -5.9 | ||||
| New Democratic | Marion Dewar | 16,861 | 32.8 | -10.6 | ||||
| Progressive Conservative | Grant Darby | 15,712 | 30.5 | +14.6 | ||||
| Christian Heritage | Charles Eleveld | 1,799 | 3.5 | |||||
| Commonwealth of Canada | Ed Gardner | 87 | 0.2 | |||||
| Independent | Rolf Gerstenberger | 70 | 0.1 | |||||
| Total valid votes | 51,463 | 100.0 | ||||||
| Canadian federal by-election, 20 July 1987 | ||||||||
|---|---|---|---|---|---|---|---|---|
| Party | Candidate | Votes | % | ±% | ||||
| Resignation of Ian Deans, 31 August 1986 | ||||||||
| New Democratic | Marion Dewar | 14,435 | 43.4 | -5.8 | ||||
| Liberal | Beth Phinney | 12,903 | 38.8 | +20.6 | ||||
| Progressive Conservative | Dan MacDonald | 5,301 | 15.9 | -16.5 | ||||
| Rhinoceros | Martin O'Hanlon | 316 | 0.9 | |||||
| Independent | John Turmel | 166 | 0.5 | |||||
| Social Credit | Andrew Varady | 149 | 0.4 | |||||
| Total valid votes | 33,270 | 100.0 | ||||||
| 1984 Canadian federal election | ||||||||
|---|---|---|---|---|---|---|---|---|
| Party | Candidate | Votes | % | ±% | ||||
| New Democratic | Ian Deans | 25,789 | 49.2 | +13.7 | ||||
| Progressive Conservative | Duncan M. Beattie | 17,004 | 32.4 | -0.1 | ||||
| Liberal | Jerry McCullough | 9,514 | 18.1 | -13.7 | ||||
| Commonwealth of Canada | Mike McGee | 133 | 0.3 | |||||
| Total valid votes | 52,440 | 100.0 | ||||||
| 1980 Canadian federal election | ||||||||
|---|---|---|---|---|---|---|---|---|
| Party | Candidate | Votes | % | ±% | ||||
| New Democratic | Ian Deans | 17,700 | 35.5 | +11.5 | ||||
| Progressive Conservative | Duncan M. Beattie | 16,208 | 32.5 | -9.3 | ||||
| Liberal | Gus MacFarlane | 15,873 | 31.8 | -2.1 | ||||
| Communist | Elizabeth Rowley | 65 | 0.1 | |||||
| Marxist–Leninist | Gerard Kimmons | 57 | 0.1 | 0.0 | ||||
| Total valid votes | 49,903 | 100.0 | ||||||
| 1979 Canadian federal election | ||||||||
|---|---|---|---|---|---|---|---|---|
| Party | Candidate | Votes | % | ±% | ||||
| Progressive Conservative | Duncan M. Beattie | 21,348 | 41.2 | +6.4 | ||||
| Liberal | Gus MacFarlane | 17,334 | 33.9 | -10.0 | ||||
| New Democratic | Andy Asselin | 12,273 | 24.0 | +3.7 | ||||
| Communist | Elizabeth Rowley | 102 | 0.2 | -0.1 | ||||
| Marxist–Leninist | Gerard Kimmons | 68 | 0.1 | 0.0 | ||||
| Total valid votes | 51,125 | 100.0 | ||||||
| 1974 Canadian federal election | ||||||||
|---|---|---|---|---|---|---|---|---|
| Party | Candidate | Votes | % | ±% | ||||
| Liberal | Gus MacFarlane | 22,253 | 43.9 | +10.9 | ||||
| Progressive Conservative | Duncan M. Beattie | 17,922 | 35.3 | -5.6 | ||||
| New Democratic | Don Gray | 10,304 | 20.3 | -5.4 | ||||
| Communist | Nancy McDonald | 170 | 0.3 | |||||
| Marxist–Leninist | Dawn Carroll | 69 | 0.1 | |||||
| Total valid votes | 50,718 | 100.0 | ||||||
| 1972 Canadian federal election | ||||||||
|---|---|---|---|---|---|---|---|---|
| Party | Candidate | Votes | % | ±% | ||||
| Progressive Conservative | Duncan M. Beattie | 21,713 | 41.0 | +16.5 | ||||
| Liberal | Harvey Lanctot | 17,477 | 33.0 | -8.2 | ||||
| New Democratic | Bill Nichols | 13,604 | 25.7 | -8.7 | ||||
| Social Credit | Roger Hamelin | 183 | 0.3 | |||||
| Total valid votes | 52,977 | 100.0 | ||||||
| 1968 Canadian federal election | ||||||||
|---|---|---|---|---|---|---|---|---|
| Party | Candidate | Votes | % | |||||
| Liberal | Gordon J. Sullivan | 17,794 | 41.2 | |||||
| New Democratic | William D. Howe | 14,838 | 34.3 | |||||
| Progressive Conservative | Duncan Beattie | 10,583 | 24.5 | |||||
| Total valid votes | 43,215 | 100.0 | ||||||
References
- "(Code 35033) Census Profile". 2011 census. Statistics Canada. 2012. Retrieved March 3, 2011.
- Federal riding history from the Library of Parliament
Notes
- Statistics Canada: 2012
- Federal Electoral Boundaries Commission for Ontario (2012). "Hamilton Mountain – Commission's Report". redecoupage-federal-redistribution.ca. Retrieved August 3, 2021.
- "Consolidated federal laws of canada, Proclamation Declaring the Representation Order to be in Force Effective on the First Dissolution of Parliament that Occurs after May 1, 2014". laws.justice.gc.ca. Legislative Services Branch. October 1, 2013. Retrieved August 4, 2021.
- "List of confirmed candidates – September 20, 2021 Federal Election". Elections Canada. Retrieved September 2, 2021.
- "List of confirmed candidates". Elections Canada. Retrieved October 4, 2019.
- "Election Night Results". Elections Canada. Retrieved November 3, 2019.
- Elections Canada – Confirmed candidates for Hamilton Mountain, 30 September 2015
- "Elections Canada – Preliminary Election Expenses Limits for Candidates". Archived from the original on August 15, 2015. Retrieved January 7, 2020.
- Pundits' Guide to Canadian Elections
- "Past results: Hamilton Mountain (Ontario), 2004-present". Elections Canada. Archived from the original on 15 January 2013. Retrieved 21 October 2012.
.png.webp)