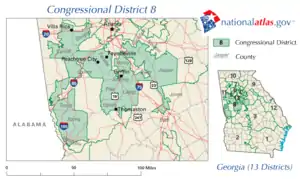
Georgia's 8th congressional district
Georgia's 8th congressional district is a congressional district in the U.S. state of Georgia. The district is currently represented by Republican Austin Scott. Though the district's boundaries have been redrawn following the 2010 census, which granted an additional congressional seat to Georgia.[5] The first election using the new district boundaries (listed below) were the 2012 congressional elections.
| Georgia's 8th congressional district | |||
|---|---|---|---|
.tif.png.webp) Georgia's 8th congressional district since January 3, 2013 | |||
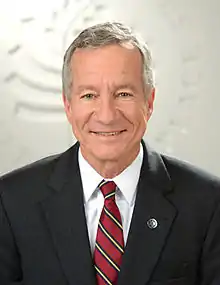
| Representative |
| ||
| Distribution |
| ||
| Population (2019) | 706,237[2] | ||
| Median household income | $50,745[3] | ||
| Ethnicity |
| ||
| Cook PVI | R+15[4] | ||
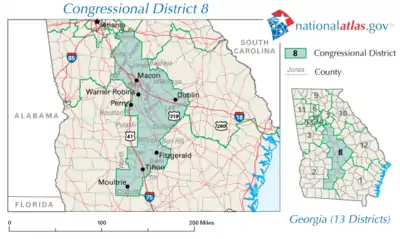
The district is located in central and south-central Georgia, and stretches from the geographical center of the state to the Florida border. The district includes the cities of Warner Robins, Tifton, Thomasville, Moultrie, and portions of Macon and Valdosta.[6][7]
Recent results in presidential elections
| Year | Office | Results |
|---|---|---|
| 2000 | President | George W. Bush 58% - Al Gore 42% |
| 2004 | President | George W. Bush 61% - John Kerry 39% |
| 2008 | President | John McCain 61.6% - Barack Obama 37.8% |
| 2012 | President | Mitt Romney 61.6% - Barack Obama 37.5% |
| 2016 | President | Donald Trump 63.3% - Hillary Clinton 34.4% |
| 2018 | Governor | Brian Kemp 64.1% - Stacey Abrams 35.2% |
| 2020 | President | Donald Trump 62% - Joe Biden 37% |
Counties
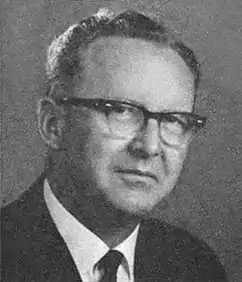
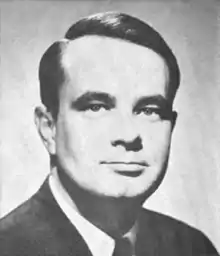
List of members representing the district


.tif.png.webp)
Election results
2006
| Party | Candidate | Votes | % | |||
|---|---|---|---|---|---|---|
| Democratic | Jim Marshall (Incumbent) | 80,660 | 50.55% | |||
| Republican | Mac Collins | 78,908 | 49.45% | |||
| Total votes | 159,568 | 100.00% | ||||
| Democratic gain from Republican | ||||||
- A Republican mid-decade redistricting made this Macon-based district more compact and somewhat more Republican. Incumbent Marshall faced a very tough challenge by former U.S. Representative Mac Collins, who represented an adjoining district from 1993 to 2005. Less than 60 percent of the population in Marshall's present 3rd District was retained in the new 8th District. The reconfigured 8th includes Butts County, which was the political base of Collins, who once served as chair of the county commission. On the other hand, the 8th also includes all of the city of Macon where Marshall served as mayor from 1995 until 1999. The race featured heavy spending, not only by the candidates themselves but also from independent groups. During the campaign, President George W. Bush attended a rally on Collins' behalf.
2008
| Party | Candidate | Votes | % | |
|---|---|---|---|---|
| Democratic | Jim Marshall (Incumbent) | 157,241 | 57.24% | |
| Republican | Rick Goddard | 117,446 | 42.76% | |
| Total votes | 274,687 | 100.00% | ||
| Democratic hold | ||||
2010
| Party | Candidate | Votes | % | |||
|---|---|---|---|---|---|---|
| Republican | Austin Scott | 102,770 | 52.70% | |||
| Democratic | Jim Marshall (Incumbent) | 92,250 | 47.30% | |||
| Total votes | 195,020 | 100.00% | ||||
| Republican gain from Democratic | ||||||
2012
| Party | Candidate | Votes | % | |
|---|---|---|---|---|
| Republican | Austin Scott (Incumbent) | 197,789 | 100.00% | |
| Total votes | 197,789 | 100.00% | ||
| Republican hold | ||||
2014
| Party | Candidate | Votes | % | |
|---|---|---|---|---|
| Republican | Austin Scott (Incumbent) | 129,938 | 100.00% | |
| Total votes | 129,938 | 100.00% | ||
| Republican hold | ||||
2016
| Party | Candidate | Votes | % | |
|---|---|---|---|---|
| Republican | Austin Scott (Incumbent) | 173,983 | 67.64% | |
| Democratic | James Harris | 83,225 | 32.36% | |
| Total votes | 257,208 | 100.00% | ||
| Republican hold | ||||
2018
| Party | Candidate | Votes | % | |
|---|---|---|---|---|
| Republican | Austin Scott (Incumbent) | 197,401 | 100.00% | |
| Total votes | 197,401 | 100.00% | ||
| Republican hold | ||||
2020
| Party | Candidate | Votes | % | |
|---|---|---|---|---|
| Republican | Austin Scott (Incumbent) | 198,701 | 64.05% | |
| Democratic | Lindsay "Doc" Holliday | 109,264 | 35.05% | |
| Total votes | 307,965 | 100.00% | ||
| Republican hold | ||||
References
- Geography, US Census Bureau. "Congressional Districts Relationship Files (state-based)". www.census.gov.
- Bureau, Center for New Media & Promotion (CNMP), US Census. "My Congressional District". www.census.gov.
- Center for New Media & Promotion (CNMP), US Census Bureau. "My Congressional District". www.census.gov.
- "Partisan Voting Index – Districts of the 115th Congress" (PDF). The Cook Political Report. April 7, 2017. Archived from the original (PDF) on June 7, 2017. Retrieved April 7, 2017.
- Justice Department approves Georgia's political maps Archived January 7, 2012, at the Wayback Machine. Atlanta Journal-Constitution. Last accessed December 27, 2011
- 2012 Congressional maps, Georgia Legislature. Last accessed January 1, 2012
- 2012 Congressional maps - closeup of Macon and Columbus, Georgia Legislature. Last accessed January 1, 2012
- Martis, Kenneth C. (1989). The Historical Atlas of Political Parties in the United States Congress. New York: Macmillan Publishing Company.
- Martis, Kenneth C. (1982). The Historical Atlas of United States Congressional Districts. New York: Macmillan Publishing Company.
- Congressional Biographical Directory of the United States 1774–present
External links
This article is issued from Wikipedia. The text is licensed under Creative Commons - Attribution - Sharealike. Additional terms may apply for the media files.