Georgia's 7th congressional district
Georgia's 7th congressional district is a congressional district in the U.S. state of Georgia. It is currently represented by Democrat Carolyn Bourdeaux. The district's boundaries have been redrawn following the 2010 census, which granted an additional congressional seat to Georgia.[3] The first election using the new district boundaries (listed below) were the 2012 congressional elections.
| Georgia's 7th congressional district | |||
|---|---|---|---|
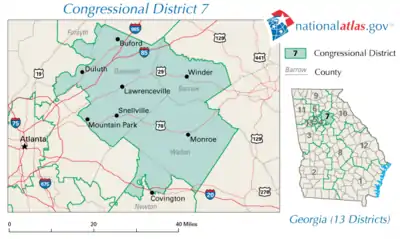
.tif.png.webp) Georgia's 7th congressional district - since January 3, 2013. | |||
| Representative |
| ||
| Distribution |
| ||
| Population (2019) | 844,773[2] | ||
| Median household income | $80,926[2] | ||
| Ethnicity |
| ||
| Cook PVI | R+2 | ||
The district includes portions of the northeast Atlanta metropolitan area, including the cities of Peachtree Corners, Norcross, Cumming, Lawrenceville, Duluth, Snellville, Suwanee, and Buford.[4] It covers most of Gwinnett County and part of Forsyth.
While the district had been considered a Republican stronghold since the mid-1990s, it has recently become friendlier to Democrats as a result of significant demographic changes, particularly the growth of Black, Hispanic and Asian populations. In the 2018 midterm elections, Republican Rob Woodall won reelection by only 433 votes, or 0.15%, against Democrat Carolyn Bourdeaux, and his victory was only confirmed after a recount. In terms of both absolute numbers and vote percentage, it was the closest U.S. House race in the country in 2018. In 2020, Bourdeaux was elected to represent the district in Congress.
Counties
- Forsyth (Partial, see also 9th district)
- Gwinnett (Partial, see also 4th district and 10th district)
History
Although the seat had been held by Republicans since 1995 until 2020, the 7th district had previously elected Democrats consistently from the Reconstruction era (1868) until the 1994 Congressional Elections.
Demographics
According to the APM Research Lab's Voter Profile Tools (featuring the U.S. Census Bureau's 2019 American Community Survey), the district contained about 502,000 potential voters (citizens, age 18+). Of these, 52% are White, 24% Black, 12% Asian, and 10% Latino. More than one-fifth (21%) of the district's potential voters are immigrants. Median income among households (with one or more potential voter) in the district is about $85,800. As for the educational attainment of potential voters in the district, 44% hold a bachelor's or higher degree.
Recent results in statewide elections
| Year | Office | Results |
|---|---|---|
| 2000 | President | George W. Bush 69% - Al Gore 31% |
| 2004 | President | George W. Bush 70% - John Kerry 30% |
| 2008 | President | John McCain 60% - Barack Obama 39% |
| 2012 | President | Mitt Romney 60.2% - Barack Obama 38.3% |
| 2016 | President | Donald Trump 51.1% - Hillary Clinton 44.8% |
| 2016 | Senate | Johnny Isakson 56.2% – Jim Barksdale 38.7% |
| 2018 | Governor | Stacey Abrams 48.8% – Brian Kemp 50.2% |
| 2018 | Lt. Governor | Geoff Duncan 50.6% – Sarah Riggs Amico 49.4% |
| 2018 | Attorney General | Chris Carr 50.4% – Charlie Bailey 49.6% |
| 2020 | President | Joe Biden 52.5% - Donald Trump 46.1% |
| 2020 | Senate | Jon Ossoff 50.7% – David Perdue 46.7% |
List of members representing the district


.png.webp)


.jpg.webp)


.tif.png.webp)

Election results
2002
| Party | Candidate | Votes | % | |
|---|---|---|---|---|
| Republican | John Linder | 138,997 | 78.91 | |
| Democratic | Michael Berlon | 37,124 | 21.08 | |
| No party | Others | 24 | 0.02 | |
| Total votes | 176,145 | 100.00 | ||
| Turnout | ||||
| Republican hold | ||||
2004
| Party | Candidate | Votes | % | |
|---|---|---|---|---|
| Republican | John Linder* | 258,982 | 100.00 | |
| Total votes | 258,982 | 100.00 | ||
| Turnout | ||||
| Republican hold | ||||
2006
| Party | Candidate | Votes | % | |
|---|---|---|---|---|
| Republican | John Linder* | 130,561 | 70.91 | |
| Democratic | Allan Burns | 53,553 | 29.09 | |
| Total votes | 184,114 | 100.00 | ||
| Turnout | ||||
| Republican hold | ||||
2008
| Party | Candidate | Votes | % | |
|---|---|---|---|---|
| Republican | John Linder* | 209,354 | 62.03 | |
| Democratic | Doug Heckman | 128,159 | 37.97 | |
| Total votes | 337,513 | 100.00 | ||
| Turnout | ||||
| Republican hold | ||||
2010
| Party | Candidate | Votes | % | |
|---|---|---|---|---|
| Republican | Rob Woodall | 160,898 | 67.07 | |
| Democratic | Doug Heckman | 78,996 | 32.93 | |
| Total votes | 239,894 | 100.00 | ||
| Turnout | ||||
| Republican hold | ||||
2012
| Party | Candidate | Votes | % | |
|---|---|---|---|---|
| Republican | Rob Woodall (incumbent) | 156,689 | 62.16 | |
| Democratic | Steve Riley | 95,377 | 37.84 | |
| Total votes | 252,066 | 100.00 | ||
| Turnout | ||||
| Republican hold | ||||
2014
| Party | Candidate | Votes | % | |
|---|---|---|---|---|
| Republican | Rob Woodall (incumbent) | 113,557 | 65.39 | |
| Democratic | Thomas Wight | 60,112 | 34.61 | |
| Total votes | 173,669 | 100.00 | ||
| Turnout | ||||
| Republican hold | ||||
2016
| Party | Candidate | Votes | % | |
|---|---|---|---|---|
| Republican | Rob Woodall (incumbent) | 174,081 | 60.38 | |
| Democratic | Rashid Malik | 114,220 | 39.62 | |
| Total votes | 288,301 | 100.00 | ||
| Turnout | ||||
| Republican hold | ||||
2018
| Party | Candidate | Votes | % | ||
|---|---|---|---|---|---|
| Republican | Rob Woodall (incumbent) | 140,430 | 50.08 | ||
| Democratic | Carolyn Bourdeaux | 140,011 | 49.92 | ||
| Total votes | 280,441 | 100.0 | |||
| Republican hold | |||||
2020
| Party | Candidate | Votes | % | |
|---|---|---|---|---|
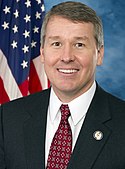
| Democratic | Carolyn Bourdeaux | 190,900 | 51.39 | |
| Republican | Rich McCormick | 180,564 | 48.61 | |
| Total votes | 371,464 | 100.0 | ||
| Democratic gain from Republican | ||||
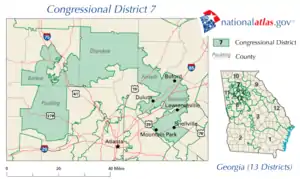
Historical district boundaries
References
- Geography, US Census Bureau. "Congressional Districts Relationship Files (state-based)". www.census.gov.
- Center for New Media & Promotion (CNMP), US Census Bureau. "My Congressional District". www.census.gov.
- Justice Department approves Georgia's political maps Archived January 7, 2012, at the Wayback Machine. Atlanta Journal-Constitution. Last accessed 2011-12-27
- 2012 Congressional maps - Metro Atlanta, Georgia Legislature. Last accessed 2012-1-1
- Martis, Kenneth C. (1989). The Historical Atlas of Political Parties in the United States Congress. New York: Macmillan Publishing Company.
- Martis, Kenneth C. (1982). The Historical Atlas of United States Congressional Districts. New York: Macmillan Publishing Company.
- Congressional Biographical Directory of the United States 1774–present
Further reading
- Amber Phillips (September 25, 2020), "The House seats most likely to flip in November", Washingtonpost.com