Ohio's 16th congressional district
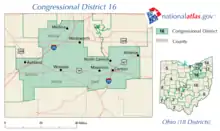
The 16th congressional district of Ohio is represented by Representative Anthony Gonzalez (R). It is located in the north east of the state, covering Wayne County and with arms extending north into the suburbs of Cleveland, and east into Greater Akron and Stark County. In the reapportionment after the 2020 census, Ohio lost a seat in the House, so this district will be eliminated when new congressional district borders take effect on January 3, 2023.[3]
| Ohio's 16th congressional district | |||
|---|---|---|---|
.tif.png.webp) Ohio's 16th congressional district - since January 3, 2013. | |||
| Representative |
| ||
| Population (2019) | 719,744 | ||
| Median household income | $68,534[1] | ||
| Ethnicity |
| ||
| Cook PVI | R+10[2] | ||
History
From 2003 to 2013, the district was based in Stark County and the Canton area, and also included Wayne County and most of Medina and Ashland counties. It also includes some rural communities east of Akron, as well as some of the western suburbs of Cleveland.
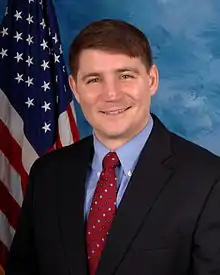
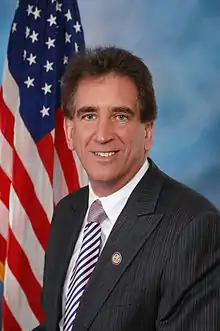
On November 2, 2010, Democrat John Boccieri lost his bid for a second term to Republican Jim Renacci, who was seated in January 2011. In January 2018, Renacci announced his candidacy for the U.S. Senate. Anthony Gonzalez was elected on November 6 to succeed him.
Election results from presidential races
| Year | Office | Result |
|---|---|---|
| 2000 | President | George W. Bush 53% - Al Gore 42% |
| 2004 | President | George W. Bush 54% - John Kerry 46% |
| 2008 | President | John McCain 50% - Barack Obama 48% |
| 2012 | President | Mitt Romney 53% - Barack Obama 45% |
| 2016 | President | Donald Trump 56% - Hillary Clinton 40% |
| 2020 | President | Donald Trump 56% - Joe Biden 42% |
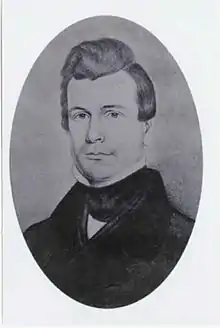
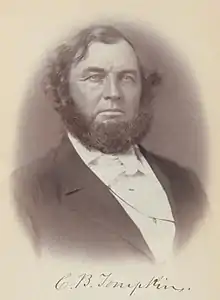
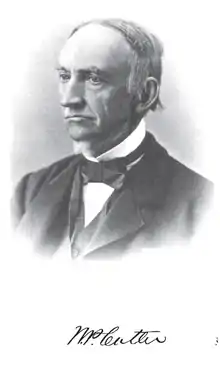
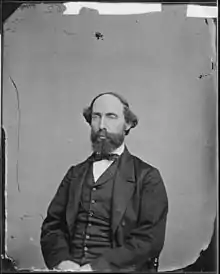
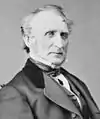
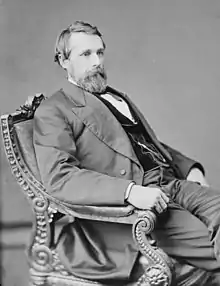
List of members representing the district
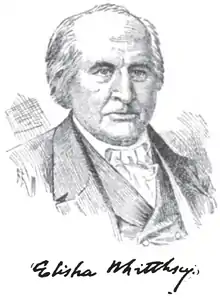
.jpg.webp)
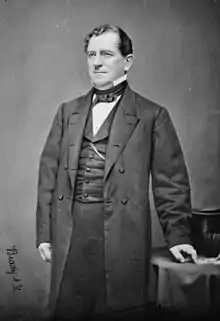
.jpg.webp)
.jpg.webp)
.jpg.webp)
-hec.12922_(cropped).jpg.webp)
.png.webp)

.jpg.webp)
_1925_or_1926_(cropped).jpg.webp)
.jpg.webp)

Election results
2010
| Party | Candidate | Votes | % | |||
|---|---|---|---|---|---|---|
| Republican | Jim Renacci | 112,902 | 52.1 | |||
| Democratic | John Boccieri (incumbent) | 89,008 | 41.1 | |||
| Libertarian | Jeffery Blevins | 14,342 | 6.6 | |||
| Independent | Robert Ross | 128 | 0 | |||
| Total votes | 216,380 | |||||
| Turnout | ||||||
| Republican gain from Democratic | ||||||
2012
| Party | Candidate | Votes | % | |
|---|---|---|---|---|
| Republican | Jim Renacci (incumbent) | 185,165 | 52.0 | |
| Democratic | Betty Sutton (incumbent) | 170,600 | 48.0 | |
| Total votes | 355,765 | 100.0 | ||
| Republican hold | ||||
2014
| Party | Candidate | Votes | % | |
|---|---|---|---|---|
| Republican | Jim Renacci (incumbent) | 132,176 | 63.7 | |
| Democratic | Pete Crossland | 75,199 | 36.3 | |
| Total votes | 207,375 | 100.0 | ||
| Republican hold | ||||
2016
| Party | Candidate | Votes | % | |
|---|---|---|---|---|
| Republican | Jim Renacci (incumbent) | 225,794 | 65.3 | |
| Democratic | Keith Mundy | 119,830 | 34.7 | |
| Total votes | 345,624 | 100.0 | ||
| Republican hold | ||||
2018
| Party | Candidate | Votes | % | ||
|---|---|---|---|---|---|
| Republican | Anthony Gonzalez | 170,029 | 56.7 | ||
| Democratic | Susan Moran Palmer | 129,681 | 43.3 | ||
| Total votes | 299,710 | 100.0 | |||
| Republican hold | |||||
2020
| Party | Candidate | Votes | % | |
|---|---|---|---|---|
| Republican | Anthony Gonzalez (incumbent) | 247,335 | 63.2 | |
| Democratic | Aaron Paul Godfrey | 144,071 | 36.8 | |
| Total votes | 391,406 | 100.0 | ||
| Republican hold | ||||
The following chart shows historic election results. Bold type indicates victor. Italic type indicates incumbent.
| Year | Democratic | Republican | Other |
|---|---|---|---|
| 2020 | Aaron Paul Godfrey: 144,071 | Anthony Gonzalez: 247,335 | |
| 2018[5] | Susan Moran Palmer: 129,681 | Anthony Gonzalez: 170,029 | |
| 2016[6] | Keith Mundy: 119,830 | James B. Renacci: 225,794 | |
| 2014[7] | Pete Crossland: 75,199 | James B. Renacci: 132,176 | |
| 2012[8] | Betty S. Sutton: 170,604 | James B. Renacci: 185,167 | |
| 2010 | John Boccieri: 89,008 | James B. Renacci: 112,902 | Jeffery Blevins (L):14,342 Robert Ross(I): 128 |
| 2008[9] | John Boccieri: 169,044 | Kirk Schuring: 136,293 | |
| 2006 | Thomas Shaw: 88,089 | Ralph S. Regula: 124,886 | |
| 2004 | Jeff Seemann: 99,210 | Ralph S. Regula: 197,990 | |
| 2002 | Jim Rice: 58,644 | Ralph S. Regula: 129,734 | |
| 2000 | William Smith: 62,709 | Ralph S. Regula: 162,294 | Richard L. Shetler (L): 6,166 Brad Graef (N): 3,231 |
| 1998 | Peter D. Ferguson: 66,047 | Ralph S. Regula: 117,426 | |
| 1996 | Thomas E. Burkhart: 64,902 | Ralph S. Regula: 159,314 | Brad Graef (N): 7,611 |
| 1994 | J. Michael Finn: 45,781 | Ralph S. Regula: 137,322 | |
| 1992 | Warner D. Mendenhall: 90,224 | Ralph S. Regula: 158,489 | |
| 1990 | Warner D. Mendenhall: 70,516 | Ralph S. Regula: 101,097 | |
| 1988 | Melvin J. Gravely: 43,356 | Ralph S. Regula: 158,824 | |
| 1986 | William J. Kennick: 36,639 | Ralph S. Regula: 118,206 | |
| 1984 | James Gwin: 58,048 | Ralph S. Regula: 152,399 | |
| 1982 | Jeffrey R. Orenstein: 57,386 | Ralph S. Regula: 110,485 | |
| 1980 | Larry V. Slagle: 39,219 | Ralph S. Regula: 149,960 | |
| 1978 | Owen S. Hand Jr.: 29,640 | Ralph S. Regula: 105,152 | |
| 1976 | John G. Freedom: 55,671 | Ralph S. Regula: 116,374 | Harold B. Festerly (A): 1,969 Mark F. Vanvoorhis (W): 77 |
| 1974 | John G. Freedom: 48,754 | Ralph S. Regula: 92,986 | |
| 1972 | Virgil L. Musser: 75,929 | Ralph S. Regula: 102,013 | |
| 1970 | Virgil L. Musser: 63,187 | Frank T. Bow: 81,208 | |
| 1968 | Virgil L. Musser: 68,916 | Frank T. Bow: 101,495 | |
| 1966 | Robert D. Freeman: 55,775 | Frank T. Bow: 87,597 | |
| 1964 | Robert D. Freeman: 93,255 | Frank T. Bow: 101,808 | |
| 1962 | Ed Witmer: 64,213 | Frank T. Bow: 96,512 | |
| 1960 | John G. Freedom: 78,257 | Frank T. Bow: 130,542 | |
| 1958 | John G. Freedom: 74,660 | Frank T. Bow: 100,678 | |
| 1956 | John McSweeney: 82,206 | Frank T. Bow: 101,324 | |
| 1954 | Thomas H. Nichols: 56,787 | Frank T. Bow: 79,371 | |
| 1952 | John McSweeney: 82,522 | Frank T. Bow: 98,447 | |
| 1950 | John McSweeney: 75,255 | Frank T. Bow: 77,306 | |
| 1948 | John McSweeney: 79,859 | Henderson H. Carson: 71,871 | |
| 1946 | William R. Thom: 51,934 | Henderson H. Carson: 65,639 | |
| 1944 | William R. Thom: 85,755 | Henderson H. Carson: 75,921 | Harry T. Whiteleather: 1,149 |
| 1942 | William R. Thom: 45,531 | Henderson H. Carson: 50,657 | |
| 1940 | William R. Thom: 92,469 | James Seccombe: 71,629 | |
| 1938 | William R. Thom: 60,382 | James Seccombe: 62,176 | |
| 1936 | William R. Thom: 89,911 | H. Ross Ake: 54,979 | A. M. Hickey: 4,552 Jacob S. Coxey Sr. (U): 2,384 |
| 1934 | William R. Thom: 59,354 | Charles B. McClintock: 45,390 | |
| 1932 | William R. Thom: 67,670 | Charles B. McClintock: 63,609 | |
| 1930 | William R. Thom: 47,237 | Charles B. McClintock: 51,113 | |
| 1928 | John McSweeney: 55,778 | Charles B. McClintock: 73,966 | Jacob S. Coxey Sr.: 1,428 Carl Guillod (W): 92 |
| 1926 | John McSweeney: 40,283 | Charles B. McClintock: 27,116 | |
| 1924 | John McSweeney: 51,491 | Thomas C. Hunsicker: 45,559 | Jacob S. Coxey Sr.: 2,901 |
| 1922 | John McSweeney: 43,590 | Joseph H. Himes: 39,881 | |
| 1920 | John McSweeney: 42,799 | Joseph H. Himes: 56,584 |
Historical district boundaries
References
- Specific
- "My Congressional District".
- "Introducing the 2021 Cook Political Report Partisan Voter Index". The Cook Political Report. April 15, 2021. Retrieved April 15, 2021.
- Exner, Rich (April 26, 2021). "Ohio loses a congressional seat in apportionment from census 2020 results". The Plain Dealer. Retrieved September 16, 2021.
- "House Results Map". The New York Times.
- "2018 Election Results". Ohio Secretary of State.
- "2016 Election Results". Ohio Secretary of State.
- "2014 Election Results". Ohio Secretary of State.
- "2012 Election Results". Ohio Secretary of State.
- "2008 Election Results". Ohio Secretary of State.
- General
- Martis, Kenneth C. (1989). The Historical Atlas of Political Parties in the United States Congress. New York: Macmillan Publishing Company.
- Martis, Kenneth C. (1982). The Historical Atlas of United States Congressional Districts. New York: Macmillan Publishing Company.
- Congressional Biographical Directory of the United States 1774–present