Demography of Greater Manchester
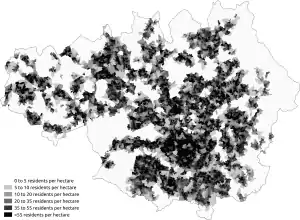
The demography of Greater Manchester is analysed by the Office for National Statistics and data is produced for each of its ten metropolitan boroughs, each of the Greater Manchester electoral wards, the NUTS3 statistical sub-regions, each of the Parliamentary constituencies in Greater Manchester, the 15 civil parishes in Greater Manchester, and for all of Greater Manchester as a whole; the latter of which had a population of 2,682,500 at the 2011 UK census.[1] Additionally, data is produced for the Greater Manchester Urban Area. Statistical information is produced about the size and geographical breakdown of the population, the number of people entering and leaving country and the number of people in each demographic subgroup.
Key statistics
| Greater Manchester Compared[2][3] | |||
|---|---|---|---|
| UK Census 2001 (ethnicity, 2005 estimates[4]) | Greater Manchester | North West (Region) | England |
| Total population | 2,547,700 | 6,729,764 | 53,012,456 |
| Foreign born | 7.2% | 5.0% | 12.7% |
| White | 88.9% | 92.9% | 85.4% |
| Asian | 6.5% | 4.1% | 7.8% |
| Black | 1.7% | 1.0% | 3.5% |
| Christian | 74% | 78% | 59.38% |
| Muslim | 5.0% | 3.0% | 5.02% |
| Hindu | 0.7% | 0.4% | 1.52% |
| No religion | 11% | 10% | 24.74% |
| Over 75 years old | 7.0% | 7.4% | 7.5% |
| Unemployed | 3.5% | 3.6% | 3.3% |
Compared against the demography of England, Greater Manchester's demographics are broadly inline with national averages on many topics. In terms of ethnicity, its Asian and British Asian population is considerably above the regional and national averages, as is the portion of residents who identify as Muslim. Compared against the demography of the United Kingdom, Greater Manchester's ethnic minority population consists of 11.09% of the total population.[5] NB. Information in the table on the right is from the 2001 census and not the most recent 2011 census.
As of 2020, the ONS estimates the population of the Greater Manchester Metropolitan County to be 2,835,686.[6]
Population change
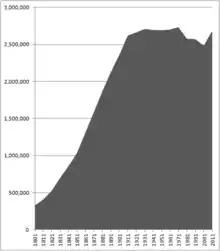
The following is a table outlining population totals of the area for every ten years since 1801, using material from the census in the United Kingdom via the Great Britain Historical GIS; pre-1974 statistics were gathered from local government areas that now comprise Greater Manchester. The total population of Greater Manchester is predicted to grow to around 2,950,000 by 2031, with the City of Manchester alone accounting for 36% of the growth.[7]
|
| ||||||||||||||||||||||||||||||||||||||||||||||||||||||||||||||||||||||||
| Source: A Vision of Britain through Time.[8] | |||||||||||||||||||||||||||||||||||||||||||||||||||||||||||||||||||||||||
Boroughs
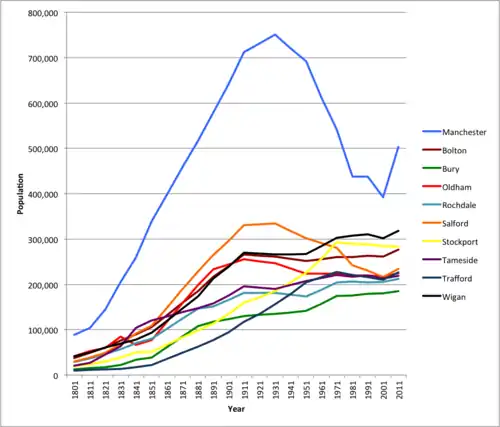
According to the 2011 census, of Greater Manchester's ten metropolitan boroughs, the City of Manchester is the most populous with a population of 503,127, whilst the Metropolitan Borough of Bury is the least populous with 185,100. The City of Manchester's population in 2021 is predicted at 532,200.[9] The city experienced the greatest percentage population growth outside London, with an increase of 19% to over 500,000.[10] Manchester's population is projected to reach 532,200 by 2021, an increase of 5.8% from 2011. This represents a slower rate of growth than the previous decade.[9]
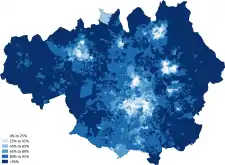
In terms of ethnic composition, the City of Manchester has the highest non-white population in Greater Manchester (34th in England), followed by the metropolitan boroughs of Oldham (45th in England), Rochdale (53rd in England), and Trafford (68th in England). Wigan is the least ethnically diverse borough in the county, and 274th in England.
The Metropolitan Borough of Oldham is the borough with the highest proportion of people under fifteen years of age.[11] Almost 12% of people in the Metropolitan Borough of Oldham are of South Asian heritage, the highest proportion of a borough of Greater Manchester.[11]
With greater affluence, a recent trend has seen some of the Pakistani community move out of the inner city into more spacious suburbs. In South Manchester this means that they have been moving from Longsight/Levenshulme to more suburban areas such as Cheadle, Chorlton and Heaton Mersey. The inner city areas that are being left are generally filled with newer immigrants from places like Iran, Afghanistan and Poland.
| Rank 2011 |
Rank 2001 |
Metropolitan district | Population in 2011 | Change 2001–2011 |
| 1 | 1 | Manchester | 503,127 | |
| 2 | 2 | Wigan | 317,800 | |
| 3 | 3 | Stockport | 283,300 | |
| 4 | 4 | Bolton | 276,800 | |
| 5 | 6 | Salford | 233,900 | |
| 6 | 8 | Trafford | 226,600 | |
| 7 | 5 | Oldham | 224,900 | |
| 8 | 7 | Tameside | 219,300 | |
| 9 | 9 | Rochdale | 211,700 | |
| 10 | 10 | Bury | 185,100 |
Ethnicity
The following table shows the ethnic group of respondents in the 2001 and 2011 censuses in Greater Manchester.
| Ethnic Group | Year | |||||
|---|---|---|---|---|---|---|
| 1991[12][13] | 2001[14] | 2011[15] | ||||
| Number | % | Number | % | Number | % | |
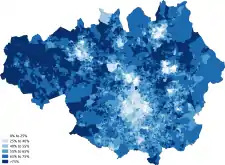
| White: Total | 2,351,239 | 94.07% | 2,260,507 | 91.06% | 2,248,123 | 83.81% |
| – | – | 2,183,096 | 87.95% | 2,141,687 | 79.84% | |
| 51,044 | 2.04% | 42,646 | 1.72% | 34,499 | 1.29% | |
| White: Gypsy or Irish Traveller[Note 2] | – | – | – | – | 1,523 | 0.06% |
| White: Other[Note 1] | – | – | 34,765 | 1.40% | 70,414 | 2.62% |
| Asian or Asian British: Total | 103,810 | 4.15% | 151,876 | 6.12% | 272,173 | 10.15% |
| 29,741 | 1.18% | 35,931 | 1.45% | 53,461 | 1.99% | |
| 49,370 | 1.97% | 75,187 | 3.03% | 130,012 | 4.85% | |
| 11,445 | 0.45% | 20,064 | 0.81% | 34,186 | 1.27% | |
| 8,323 | 0.33% | 11,858 | 0.48% | 26,079 | 0.97% | |
| Asian or Asian British: Other Asian | 4,931 | 0.19% | 8,836 | 0.36% | 28,435 | 1.06% |
| Black or Black British: Total | 31,537 | 1.26% | 29,747 | 1.20% | 74,097 | 2.76% |
| Black or Black British: African | 5,240 | 0.20% | 16,233 | 0.65% | 17,767 | 0.66% |
| Black or Black British: Caribbean | 17,095 | 0.68% | 10,255 | 0.41% | 44,691 | 1.67% |
| Black or Black British: Other Black | 9,202 | 0.36% | 3,259 | 0.13% | 11,639 | 0.43% |
| Mixed: Total[Note 1] | – | – | 32,901 | 1.33% | 60,710 | 2.26% |
| Mixed: White and Black Caribbean | – | – | 13,104 | 0.53% | 23,131 | 0.86% |
| Mixed: White and Black African | – | – | 4,860 | 0.20% | 9,997 | 0.37% |
| Mixed: White and Asian | – | – | 8,547 | 0.34% | 15,657 | 0.58% |
| Mixed: Other Mixed | – | – | 6,390 | 0.26% | 11,925 | 0.44% |
| Other: Total | 12,855 | 0.51% | 7,297 | 0.29% | 27,425 | 1.02% |
| Other: Arab[Note 2] | – | – | – | – | 15,026 | 0.56% |
| Other: Any other ethnic group | 12,855 | 0.51% | 7,297 | 0.29% | 12,399 | 0.46% |
| Total | 2,499,441 | 100.00% | 2,482,328 | 100.00% | 2,682,528 | 100.00% |
Notes for table above
- New category created for the 2001 census
- New category created for the 2011 census
- In 2001, listed under the 'Other ethnic group' heading.
 White
White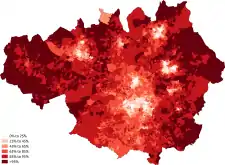 White-British
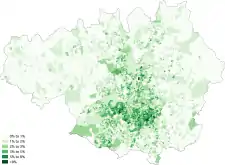 White-Irish
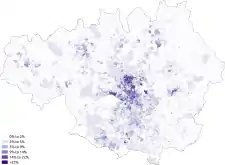 White-Other
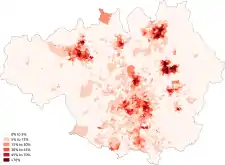 Asian
Asian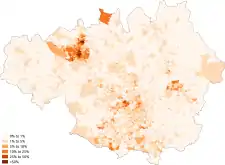 Asian-Indian
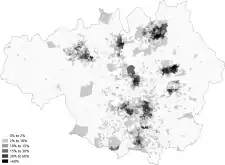 Asian-Pakistani
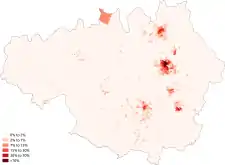 Asian-Bangladeshi
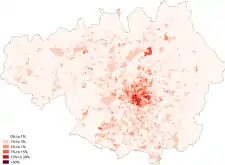 Asian-Chinese
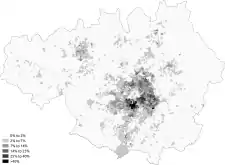 Black
Black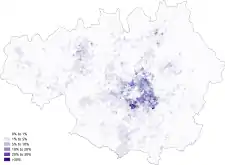 Black-African
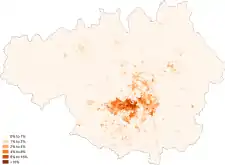 Black-Caribbean
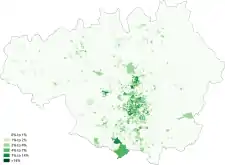 Other-Arab
Children in Manchester
In the City of Manchester, children from BAME backgrounds live in the North, East and Central parts of the city. Children from an Asian ethnic background are concentrated in Crumpsall, Cheetham, Longsight and Levenshulme. Children from a Black ethnic background are spread around North and East Manchester and in a high concentration in Moss Side. Highest concentrations of EAL pupils are in Longsight, Levenshulme, Crumpsall and Moss Side.[16]
Armenians
Manchester has been home to an Armenian population since 1835, with 30 Armenian businesses thought to have been operating in the city by 1862.[17] The first group of Armenians to arrive were silk merchants. In Easter 1870 Holy Trinity Church, an Armenian church, opened in Manchester, making it the first religious institution of that kind of in Western Europe. The Armenian Ladies Association of Manchester was in existence by the 1920s.[18]
Languages
The most common main languages spoken in Greater Manchester according to the 2011 census are shown below.[19]
| Rank | Language | Usual residents aged 3+ | Proportion |
|---|---|---|---|
| 1 | English | 2,370,094 | 92.12% |
| 2 | Urdu | 31,712 | 1.23% |
| 3 | Polish | 21,231 | 0.83% |
| 4 | Bengali (with Sylheti and Chatgaya) | 16,946 | 0.66% |
| 5 | Punjabi | 16,189 | 0.63% |
| 6 | Gujarati | 11,651 | 0.45% |
| 7 | Arabic | 10,914 | 0.42% |
| 8 | Persian/Farsi | 5,654 | 0.22% |
| 9 | French | 4,924 | 0.19% |
| 10 | Somali | 3,868 | 0.15% |
| 11 | Kurdish | 3,656 | 0.14% |
| 12 | Portuguese | 3,620 | 0.14% |
| 13 | Cantonese Chinese | 3,440 | 0.13% |
| 14 | Spanish | 3,252 | 0.13% |
| 15 | Pashto | 2,684 | 0.10% |
| 16 | Italian | 2,292 | 0.09% |
| 17 | Greek | 2,199 | 0.09% |
| 18 | Czech | 2,129 | 0.08% |
| 19 | German | 2,088 | 0.08% |
| 20 | Pakistani Pahari (with Mirpuri and Potwari) | 1,991 | 0.08% |
| Other | 52,197 | 2.03% |
Religion
The following table shows the religion of respondents in the 2001 and 2011 censuses in Greater Manchester.
| Religion | 2001[20] | 2011[21] | ||
|---|---|---|---|---|
| Number | % | Number | % | |
| Christian | 1,840,599 | 74.15% | 1,657,594 | 61.79% |
| Buddhist | 5,156 | 0.21% | 9,555 | 0.36% |
| Hindu | 17,260 | 0.70% | 23,478 | 0.88% |
| Jewish | 21,733 | 0.88% | 25,013 | 0.93% |
| Muslim | 125,219 | 5.04% | 232,787 | 8.68% |
| Sikh | 3,720 | 0.15% | 5,322 | 0.20% |
| Other religion | 4,301 | 0.17% | 7,429 | 0.28% |
| No religion | 281,273 | 11.33% | 557,129 | 20.77% |
| Religion not stated | 183,067 | 7.37% | 164,221 | 6.12% |
| Total | 2,482,328 | 100.00% | 2,682,528 | 100.00% |
 Christianity
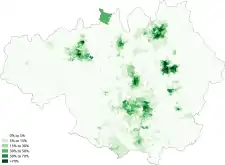 Islam
Islam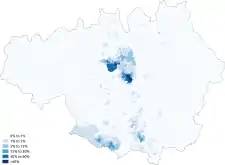 Judaism
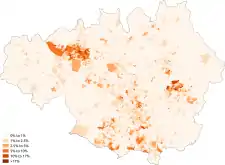 Hinduism
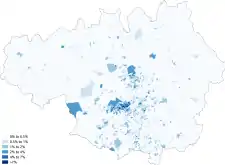 Sikhism
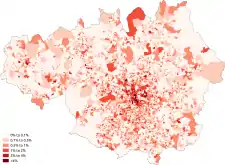 Buddhism
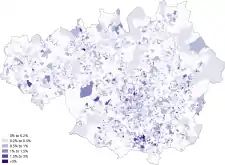 Other religion
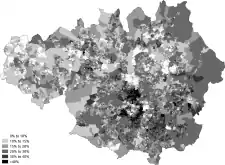 No religion
Eurostat NUTS
In the Eurostat Nomenclature of Territorial Units for Statistics (NUTS), Greater Manchester is a level-2 NUTS region, coded "UKD3", which is subdivided into the "Greater Manchester South" (UKD31) and "Greater Manchester North" (UKD32) level-3 regions.
Urban and metropolitan area
At the 2001 census, the population of the Greater Manchester Urban Area was 2,240,230.[22] This area does not include some outliers within Greater Manchester, such as Wigan, but does extend into the adjacent counties of Lancashire and Cheshire. Eurostat has developed a harmonising standard for comparing metropolitan areas in the European Union and the population of the Greater Manchester Larger Urban Zone is 2,600,100; it occupies an area of 1,280 square kilometres (490 sq mi). The Greater Manchester LUZ is the second most populous within the United Kingdom, behind that of London, and sixteenth most populous within the EU.
See also
- Demography of the United Kingdom
- Demography of England
- Demography of London
- Demography of Birmingham
- Religion in England
- List of English cities by population
- List of English districts by population
- List of English districts and their ethnic composition
- List of English districts by area
- List of English districts by population density
Notes
- New category created for the 2001 census
- New category created for the 2011 census
- In 2001, listed under the 'Other ethnic group' heading.
References
- "2011 Census, Greater Manchester Gets Bigger". manchesterconfidential.co.uk. 18 July 2012. Archived from the original on 30 August 2012. Retrieved 1 October 2012.
- United Kingdom Census 2001 (17 January 2007). "2001 Census; Key facts sheets". manchester.gov.uk. Archived from the original on 21 July 2006. Retrieved 10 July 2007.
- United Kingdom Census 2001 (2001). "Greater Manchester (Health Authority)". neighbourhood.statistics.gov.uk. Retrieved 10 July 2007.
- "Local statistics - Office for National Statistics". neighbourhood.statistics.gov.uk. Retrieved 19 April 2018.
- .
- "Estimates of the population for the UK, England and Wales, Scotland and Northern Ireland". Office for National Statistics. 24 June 2020. Retrieved 18 October 2020.
- Times Books 2010, p. 192.
- A Vision of Britain through time. "Greater Manchester Met.C: Total Population". Retrieved 6 April 2007.
- Council, Manchester City. "Manchester City Council download - Population reports - The Council & democracy - Statistics & intelligence". www.manchester.gov.uk. Retrieved 19 April 2018.
- Westcott, Lucy Townsend and Kathryn (17 July 2012). "Five lesser-spotted things in the census". Retrieved 19 April 2018 – via www.bbc.co.uk.
- "BOROUGH PROFILE: Oldham". Greater Manchester Fire and Rescue Service. 2002. Archived from the original on 18 May 2007. Retrieved 10 February 2007.
- As UK Census data past 2001 is unavailable through the ONS website, it has been recommended to use archival census collection websites to obtain data. Data is taken from United Kingdom Casweb Data services of the United Kingdom 1991 Census on Ethnic Data for England > Greater Manchester (Table 6).
- Office of Population Censuses and Surveys ; General Register Office for Scotland ; Registrar General for Northern Ireland (1997): 1991 Census aggregate data. UK Data Service (Edition: 1997). DOI: http://dx.doi.org/10.5257/census/aggregate-1991-1 This information is licensed under the terms of the Open Government Licence [http://www.nationalarchives.gov.uk/doc/open-government-licence/version/2]
- "2001 census - theme tables". NOMIS. Retrieved 5 September 2014.
- "Download:local authorities: county / unitary". NOMIS. Retrieved 2 September 2014.
- Allerton, Leonie (2021). "A profile of Manchester's children from birth to 16 years old" (PDF). Manchester City Council Shared Intelligence, PRI. Children in Manchester: 6 – via Manchester City Council.
- "Multi-Cultural Manchester: Armenians". Manchester City Council. Archived from the original on 7 September 2009. Retrieved 22 August 2009.
- "Armenian Merchants in Exile". Archives Plus. Manchester Central Library. Retrieved 26 May 2019.
- "Download:local authorities: county / unitary". NOMIS. Retrieved 5 September 2014.
- "2001 census - theme tables". Retrieved 5 September 2014.
- "Download:local authorities: county / unitary". NOMIS. Retrieved 2 September 2014.
- Key Statistics for urban areas in England and Wales Archived 15 February 2006 at the Wayback Machine, 2001 Census. URL accessed 21 February 2007.
Bibliography
- Times Books (2 September 2012). The Times Atlas of Britain. Times Books. ISBN 978-0-00-734583-0.