Demographics of Asia
The continent of Asia covers 29.4% of the Earth's land area and has a population of around 4.69 billion (as of 2021),[1] accounting for about 60% of the world population. The combined population of both China and India are estimated to be over 2.8 billion people as of 2021. Asia's population is projected to grow to 5.26 billion by 2050, or about 54% of projected world population at that time.[2] Population growth in Asia was close to 1.2% p.a. as of 2015, with highly disparate rates. Many Western Asian countries have growth rates above 2% p.a., notably Pakistan at 2.4% p.a., while China has a growth rate below 0.5% p.a..
Population
Population of Asia, 1–1820 A.D. (million)
Source: Maddison et al.[3]
| Year[3] | 1 | 1000 | 1500 | 1600 | 1700 | 1820 |
|---|---|---|---|---|---|---|
| China | 59.6 | 59.0 | 103.0 | 160.0 | 138.0 | 381.0 |
| India | 75.0 | 75.0 | 110.0 | 135.0 | 165.0 | 209.0 |
| Japan | 3.0 | 7.5 | 15.4 | 18.5 | 27.0 | 31.0 |
| Korea | 1.6 | 3.9 | 8.0 | 10.0 | 12.2 | 13.8 |
| Indonesia | 2.8 | 5.2 | 10.7 | 11.7 | 13.1 | 17.9 |
| Indochina | 1.1 | 2.2 | 4.5 | 5.0 | 5.9 | 8.9 |
| Other East Asia | 5.9 | 9.8 | 14.4 | 16.9 | 19.8 | 23.6 |
| Iran | 4.0 | 4.5 | 4.0 | 5.0 | 5.0 | 6.6 |
| Turkey | 6.1 | 7.3 | 6.3 | 7.9 | 8.4 | 10.1 |
| Other West Asia | 15.1 | 8.5 | 7.5 | 8.5 | 7.4 | 8.5 |
| Total Asia | 174.2 | 182.9 | 283.8 | 378.5 | 401.8 | 710.4 |
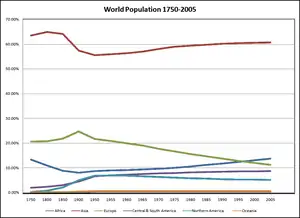
Shares of World Population, Asia, 1–1998 A.D. (per cent of world total)
Source: Maddison et al.[3]
| Year[3] | 1 | 1000 | 1500 | 1600 | 1700 | 1820 | 1870 | 1913 | 1950 | 1973 | 1998 |
|---|---|---|---|---|---|---|---|---|---|---|---|
| Japan | 1.3 | 2.8 | 3.5 | 3.3 | 4.5 | 3.0 | 2.7 | 2.9 | 3.3 | 2.8 | 2.1 |
| China | 25.8 | 22.0 | 23.5 | 28.8 | 22.9 | 36.6 | 28.2 | 24.4 | 21.7 | 22.5 | 21.0 |
| India | 32.5 | 28.0 | 25.1 | 24.3 | 27.3 | 20.1 | 19.9 | 17.0 | 14.2 | 14.8 | 16.5 |
| Other Asia | 15.9 | 15.4 | 12.7 | 11.7 | 11.9 | 8.6 | 9.4 | 10.3 | 15.5 | 17.3 | 19.8 |
| Total Asia (excluding Japan) | 74.2 | 65.4 | 61.3 | 64.8 | 62.1 | 65.3 | 57.5 | 51.7 | 51.4 | 54.7 | 57.4 |
| World | 100.0 | 100.0 | 100.0 | 100.0 | 100.0 | 100.0 | 100.0 | 100.0 | 100.0 | 100.0 | 100.0 |
Countries Ranking By International Organisations
| Countries | Population | TFR | HDI |
|---|---|---|---|
| 1,433,783,686 | 1.7 | 0.761 | |
| 1,366,417,754 | 2.2 | 0.645 | |
| 270,625,568 | 2.3 | 0.718 | |
| 216,565,318 | 3.5 | 0.557 | |
| 163,046,161 | 2.0 | 0.632 | |
| 126,860,301 | 1.4 | 0.919 | |
| 108,116,615 | 2.5 | 0.718 | |
| 96,462,106 | 2.0 | 0.704 | |
| 83,429,615 | 2.1 | 0.82 | |
| 82,913,906 | 2.1 | 0.783 | |
| 69,037,513 | 1.5 | 0.777 | |
| 54,045,420 | 2.1 | 0.583 | |
| 51,225,308 | 0.9 | 0.916 | |
| 39,309,783 | 3.6 | 0.674 | |
| 38,041,754 | 4.3 | 0.511 | |
| 34,268,528 | 2.3 | 0.854 | |
| 32,981,716 | 2.8 | 0.72 | |
| 31,949,777 | 2.0 | 0.81 | |
| 29,161,922 | 3.7 | 0.47 | |
| 28,608,710 | 1.9 | 0.602 | |
| 25,666,161 | 1.9 | NA | |
| 21,323,733 | 2.2 | 0.782 | |
| 18,551,427 | 2.9 | 0.825 | |
| 17,070,135 | 2.8 | 0.567 | |
| 16,486,542 | 2.5 | 0.594 | |
| 10,101,694 | 3.0 | 0.729 | |
| 10,047,718 | 1.8 | 0.756 | |
| 9,770,529 | 1.4 | 0.89 | |
| 9,321,018 | 3.6 | 0.668 | |
| 8,519,377 | 3.0 | 0.919 | |
| 7,436,154 | 1.1 | 0.949 | |
| 7,169,455 | 2.6 | 0.613 | |
| 6,855,713 | 2.1 | 0.744 | |
| 6,415,850 | 3.3 | 0.697 | |
| 5,942,089 | 2.7 | 0.715 | |
| 5,804,337 | 1.1 | 0.938 | |
| 4,974,986 | 2.8 | 0.813 | |
| 4,207,083 | 2.1 | 0.806 | |
| 3,996,765 | 2.1 | 0.812 | |
| 3,225,167 | 2.9 | 0.737 | |
| 2,957,731 | 1.8 | 0.776 | |
| 2,832,067 | 1.8 | 0.848 | |
| 1,641,172 | 2 | 0.852 | |
| 1,293,119 | 3.9 | 0.606 | |
| 1,179,551 | 1.3 | 0.887 | |
| 763,092 | 2.0 | 0.654 | |
| 640,445 | 1.2 | NA | |
| 530,953 | 1.8 | 0.74 | |
| 433,285 | 1.8 | 0.838 | |
| Asia | 4,572,008,809 | 2.1 | 0.703 |
| Population Replacement | 2.1 | ||
Economy
Economically, most of Asia is traditionally considered part of the Second World, with the significant exception of the industrialized First World countries of Israel, Japan, Taiwan and South Korea. Asian countries in the G-20 major economies include China, Japan, South Korea, India, Indonesia, Turkey and Saudi Arabia. Of these, Japan is also in the G8, and additionally China and India in the G8+5.
The Human Development Index of Asian countries range from Low to Very High category. The table below shows the 10 highest and lowest countries according to their Human Development Index scores based on the 2019 report.[5]
|
10 highest HDIs
|
10 lowest HDIs
| ||||||||||||||||||||||||||||||||||||||||||||||||||||||||||||||||||||||||||||||||||
Ethnicities
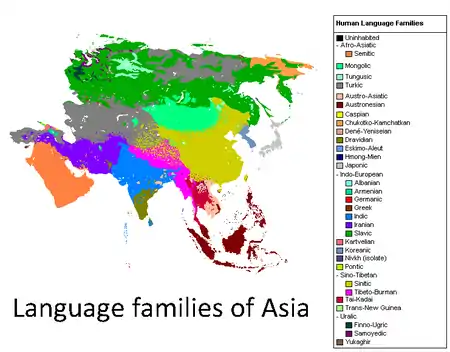
- Central Asian peoples: Turkic peoples, Iranian peoples
- East Asian peoples: List of Chinese ethnic groups (historical), Japanese people, Koreans, Mongols
- South Asian peoples: Ethnic groups of India, Ethnic groups in Pakistan, Dravidians, Indo-Aryans, Munda people
- Southeast Asian peoples: Austronesian peoples, Tai peoples; List of ethnic groups in Cambodia, ethnic groups in Indonesia, List of ethnic groups in Laos, Ethnic groups of the Philippines, List of ethnic groups in Vietnam
- West Asian peoples: Arab people, Jews, Samaritans, Druze, Peoples of the Caucasus (transcontinental), Ethnic minorities in Iran, Ethnic minorities in Iraq; Iranian peoples, Turkmen, Turks
References
- "Asia Population". Worldometer. Worldometer. Retrieved 5 October 2021.
- "World Population Prospects - Population Division - United Nations". esa.un.org. Archived from the original on 2018-01-24. Retrieved 2017-11-29.
- Maddison. "Growth of World Population, GDP and GDP Per Capita before 1820" (PDF).
- "Fertility rate, total (births per woman) | Data". data.worldbank.org. Archived from the original on January 20, 2020.
- "Human Development Report 2019 – "Human Development Indices and Indicators"" (PDF). HDRO (Human Development Report Office) United Nations Development Programme. pp. 22–25. Retrieved 23 February 2020.
External links
| Wikimedia Commons has media related to Demographics of Asia. |