List of countries by military expenditures
This is a list of countries by military expenditure in a given year. Military expenditure figures are presented in United States dollars based on either constant or current exchange rates.[1]

Military expenditure, total
- Stockholm International Peace Research Institute (SIPRI) 2022 fact sheet
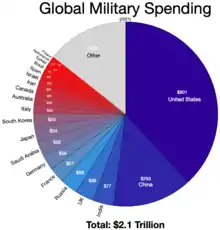
The first list is based on the SIPRI fact sheet which includes a list of the world's top 15 military spenders in 2022, based on current market exchange rates.[1]
The second list is based on the 2022 edition of "The Military Balance" published by the International Institute for Strategic Studies (IISS) using average market exchange rates.[2]
Russian and Chinese military spending are actually far higher than the chart due to captive markets and Purchasing Price Parity in those countries.[3][4]
| List by the Stockholm International Peace Research Institute 2022 Fact Sheet (for 2021)[1] SIPRI Military Expenditure Database[5] |
List by the International Institute for Strategic Studies Top 15 Defence Budgets 2021[6] | ||||||||||||||||||||||||||||||||||||||||||||||||||||||||||||||||||||||||||||||||||||||||||||||||||||||||||||||||||||||||||||||||||||||||||||||||||||||||||||||
|
|
| Country | Spending (US$ bn) |
Population | Spending per capita
(US $) |
GDP
(US$ bn) |
% of GDP |
|---|---|---|---|---|---|
| Afghanistan | 12.00 | 40,754,388 | 294.45 | 19.54 | 61.40 |
| Albania | 0.25 | 2,866,374 | 87.22 | 13.04 | 1.92 |
| Algeria | 13.00 | 45,350,148 | 286.66 | 167.56 | 7.76 |
| Angola | 7.00 | 35,027,343 | 199.84 | 122.12 | 5.73 |
| Argentina | 4.20 | 46,010,234 | 91.28 | 637.43 | 0.66 |
| Armenia | 1.39 | 2,971,966 | 467.70 | 11.54 | 12.05 |
| Australia | 26.30 | 26,068,792 | 1008.87 | 1323.42 | 1.99 |
| Austria | 3.38 | 9,066,710 | 372.79 | 416.84 | 0.81 |
| Azerbaijan | 2.81 | 10,300,205 | 272.81 | 40.75 | 6.90 |
| Bahrain | 1.42 | 1,783,983 | 795.97 | 35.43 | 4.01 |
| Bangladesh | 3.80 | 167,885,689 | 22.63 | 249.72 | 1.52 |
| Belgium | 4.92 | 11,668,278 | 421.66 | 494.76 | 0.99 |
| Bhutan | 0.03 | 787,941 | 31.88 | 2.53 | 0.99 |
| Bolivia | 0.66 | 11,992,656 | 55.03 | 37.51 | 1.76 |
| Bosnia and Herzegovina | 0.17 | 3,249,317 | 50.78 | 18.05 | 0.91 |
| Botswana | 0.45 | 2,441,162 | 184.34 | 17.41 | 2.59 |
| Brazil | 27.80 | 215,353,593 | 129.09 | 2053.59 | 1.35 |
| Bulgaria | 1.08 | 6,844,597 | 157.79 | 58.22 | 1.86 |
| Burkina Faso | 0.13 | 22,102,838 | 5.88 | 12.32 | 1.05 |
| Cambodia | 0.60 | 17,168,639 | 35.18 | 22.16 | 2.73 |
| Cameroon | 0.35 | 27,911,548 | 12.43 | 34.92 | 0.99 |
| Canada | 22.50 | 38,388,419 | 586.11 | 1647.12 | 1.37 |
| Central African Republic | 0.02 | 5,016,678 | 3.99 | 1.95 | 1.03 |
| Chad | 0.20 | 17,413,580 | 11.49 | 9.87 | 2.03 |
| Chile | 4.25 | 19,250,195 | 220.78 | 277.08 | 1.53 |
| China | 237.00 | 1,448,471,400 | 163.62 | 12237.70 | 1.94 |
| Colombia | 10.60 | 51,512,762 | 205.77 | 314.46 | 3.37 |
| Croatia | 0.80 | 4,059,286 | 197.08 | 55.21 | 1.45 |
| Cuba | 0.50 | 11,305,652 | 44.23 | 96.85 | 0.52 |
| Czech Republic | 2.97 | 10,736,784 | 276.62 | 215.91 | 1.38 |
| Denmark | 4.76 | 5,834,950 | 815.77 | 329.87 | 1.44 |
| Dominican Republic | 0.76 | 11,056,370 | 68.74 | 75.93 | 1.00 |
| Democratic Republic of the Congo | 0.10 | 95,240,792 | 1.05 | 37.64 | 0.27 |
| Ecuador | 2.50 | 18,113,361 | 138.02 | 104.30 | 2.40 |
| Egypt | 11.20 | 106,156,692 | 105.50 | 235.37 | 4.76 |
| El Salvador | 0.17 | 6,550,389 | 25.49 | 24.81 | 0.67 |
| Estonia | 0.69 | 1,321,910 | 518.19 | 26.61 | 2.57 |
| Ethiopia | 0.35 | 120,812,698 | 2.90 | 80.56 | 0.43 |
| Finland | 3.57 | 5,554,960 | 642.67 | 252.30 | 1.41 |
| France | 41.50 | 65,584,518 | 632.77 | 2582.50 | 1.61 |
| Gabon | 0.08 | 2,331,533 | 35.60 | 15.01 | 0.55 |
| Georgia | 0.33 | 3,968,738 | 82.39 | 15.08 | 2.17 |
| Germany | 50.00 | 83,883,596 | 596.06 | 3693.20 | 1.35 |
| Ghana | 0.71 | 32,395,450 | 21.92 | 59.00 | 1.20 |
| Greece | 4.84 | 10,316,637 | 469.15 | 203.09 | 2.38 |
| Guatemala | 0.24 | 18,584,039 | 12.91 | 75.62 | 0.32 |
| Honduras | 0.21 | 10,221,247 | 20.06 | 22.98 | 0.89 |
| Hungary | 2.08 | 9,606,259 | 216.53 | 139.76 | 1.49 |
| India | 61.00 | 1,406,631,776 | 43.37 | 2650.73 | 2.30 |
| Indonesia | 7.60 | 279,134,505 | 27.23 | 1015.42 | 0.75 |
| Iran | 19.60 | 86,022,837 | 227.85 | 454.01 | 4.32 |
| Iraq | 1.73 | 42,164,965 | 41.03 | 192.06 | 0.90 |
| Ireland | 0.87 | 5,020,199 | 173.30 | 331.43 | 0.26 |
| Israel | 20.00 | 8,922,892 | 2241.43 | 353.27 | 5.66 |
| Italy | 27.80 | 60,262,770 | 461.31 | 1943.84 | 1.43 |
| Ivory Coast | 0.55 | 27,742,298 | 19.83 | 37.35 | 1.47 |
| Japan | 49.00 | 125,584,838 | 390.17 | 4872.42 | 1.01 |
| Jordan | 2.60 | 10,300,869 | 252.41 | 40.07 | 6.49 |
| Kazakhstan | 4.00 | 19,205,043 | 208.28 | 162.89 | 2.46 |
| Kenya | 0.12 | 56,215,221 | 2.15 | 79.26 | 0.15 |
| Kuwait | 6.83 | 4,380,326 | 1559.24 | 120.13 | 5.69 |
| Kyrgyzstan | 0.02 | 6,728,271 | 2.97 | 7.56 | 0.26 |
| Laos | 0.02 | 7,481,023 | 2.47 | 16.85 | 0.11 |
| Latvia | 0.72 | 1,848,837 | 391.60 | 30.46 | 2.38 |
| Lebanon | 2.50 | 6,684,849 | 373.98 | 53.58 | 4.67 |
| Liberia | 0.01 | 5,305,117 | 2.45 | 3.29 | 0.40 |
| Libya | 3.00 | 7,040,745 | 426.09 | 38.11 | 7.87 |
| Lithuania | 1.11 | 2,661,708 | 417.03 | 47.54 | 2.33 |
| Madagascar | 0.12 | 29,178,077 | 3.94 | 11.50 | 1.00 |
| Malaysia | 4.00 | 33,181,072 | 120.55 | 314.71 | 1.27 |
| Mali | 0.07 | 21,473,764 | 3.26 | 15.33 | 0.46 |
| Mauritania | 0.05 | 4,901,981 | 10.25 | 5.02 | 1.00 |
| Mexico | 7.00 | 131,562,772 | 53.21 | 1150.89 | 0.61 |
| Moldova | 0.03 | 4,013,171 | 7.48 | 8.13 | 0.37 |
| Mongolia | 0.16 | 3,378,078 | 45.88 | 11.43 | 1.36 |
| Montenegro | 0.07 | 627,950 | 103.51 | 4.84 | 1.34 |
| Morocco | 10.00 | 37,772,756 | 264.74 | 109.71 | 9.12 |
| Mozambique | 0.25 | 33,089,461 | 7.40 | 12.65 | 1.94 |
| Myanmar | 2.65 | 55,227,143 | 47.98 | 67.07 | 3.95 |
| Namibia | 0.51 | 2,633,874 | 191.73 | 13.25 | 3.81 |
| Nepal | 0.21 | 30,225,582 | 7.05 | 24.88 | 0.86 |
| Netherlands | 12.42 | 17,211,447 | 721.61 | 830.57 | 1.50 |
| New Zealand | 4.30 | 4,898,203 | 877.87 | 204.14 | 2.11 |
| Nicaragua | 0.14 | 6,779,100 | 20.65 | 13.81 | 1.01 |
| Nigeria | 2.15 | 216,746,934 | 9.92 | 375.75 | 0.57 |
| North Korea | 1.60 | 25,990,679 | 61.56 | ||
| North Macedonia | 0.11 | 2,081,304 | 51.96 | 11.28 | 0.96 |
| Norway | 7.18 | 5,511,370 | 1302.76 | 399.49 | 1.80 |
| Oman | 8.69 | 5,323,993 | 1632.23 | 70.78 | 12.28 |
| Pakistan | 11.40 | 229,488,994 | 49.68 | 304.95 | 3.74 |
| Panama | 0.50 | 4,446,964 | 112.44 | 62.28 | 0.80 |
| Paraguay | 0.25 | 7,305,843 | 34.22 | 39.67 | 0.63 |
| Peru | 2.56 | 33,684,208 | 76.00 | 211.39 | 1.21 |
| Philippines | 3.47 | 112,508,994 | 30.84 | 313.60 | 1.11 |
| Poland | 12.00 | 37,739,785 | 317.97 | 526.47 | 2.28 |
| Portugal | 3.36 | 10,140,570 | 331.34 | 219.31 | 1.53 |
| Qatar | 6.00 | 2,979,915 | 2013.48 | 166.93 | 3.59 |
| Republic of the Congo | 0.72 | 5,797,805 | 123.32 | 8.70 | 8.22 |
| Romania | 5.05 | 19,031,335 | 265.35 | 211.88 | 2.38 |
| Russia | 48.00 | 145,805,947 | 329.20 | 1578.42 | 3.04 |
| Saudi Arabia | 67.60 | 35,844,909 | 1885.90 | 686.74 | 9.84 |
| Serbia | 0.91 | 8,653,016 | 104.82 | 41.43 | 2.19 |
| Sierra Leone | 0.08 | 8,306,436 | 9.09 | 3.78 | 2.00 |
| Singapore | 11.20 | 5,943,546 | 1884.40 | 323.91 | 3.46 |
| Slovakia | 2.12 | 5,460,193 | 388.26 | 95.62 | 2.22 |
| Slovenia | 0.58 | 2,078,034 | 279.59 | 48.77 | 1.19 |
| Somalia | 0.06 | 16,841,795 | 3.69 | ||
| South Africa | 4.30 | 60,756,135 | 70.45 | 348.87 | 1.23 |
| South Korea | 44.00 | 51,329,899 | 857.20 | 1530.75 | 2.87 |
| South Sudan | 0.08 | 11,618,511 | 6.89 | ||
| Spain | 15.10 | 46,719,142 | 323.21 | 1314.31 | 1.15 |
| Sri Lanka | 2.50 | 21,575,842 | 115.87 | 87.36 | 2.86 |
| Sudan | 2.47 | 45,992,020 | 53.70 | 117.49 | 2.10 |
| Suriname | 0.06 | 596,831 | 105.56 | 3.00 | 2.10 |
| Sweden | 6.33 | 10,218,971 | 619.44 | 535.61 | 1.18 |
| Switzerland | 5.00 | 8,773,637 | 569.89 | 678.97 | 0.74 |
| Syria | 1.80 | 19,364,809 | 92.95 | ||
| Taiwan | 10.72 | 23,888,595 | 448.75 | ||
| Tajikistan | 1.60 | 9,957,464 | 160.68 | 7.15 | 22.39 |
| Tanzania | 0.22 | 63,298,550 | 3.52 | 53.32 | 0.42 |
| Thailand | 7.10 | 70,078,203 | 101.32 | 455.30 | 1.56 |
| Tunisia | 0.55 | 12,046,656 | 45.66 | 39.95 | 1.38 |
| Turkey | 19.00 | 85,561,976 | 222.06 | 851.55 | 2.23 |
| Turkmenistan | 0.20 | 6,201,943 | 32.25 | 37.93 | 0.53 |
| Uganda | 0.94 | 48,432,863 | 19.31 | 26.00 | 3.60 |
| Ukraine | 5.40 | 43,192,122 | 125.02 | 112.15 | 4.81 |
| United Arab Emirates | 22.75 | 10,081,785 | 2256.54 | 382.58 | 5.95 |
| United Kingdom | 55.10 | 68,497,907 | 804.40 | 2637.87 | 2.09 |
| United States | 750.00 | 334,805,269 | 2240.11 | 19485.39 | 3.85 |
| Uruguay | 4.95 | 3,496,016 | 1415.90 | 56.16 | 8.81 |
| Uzbekistan | 0.98 | 34,382,084 | 28.36 | 49.68 | 1.96 |
| Venezuela | 0.75 | 29,266,991 | 25.46 | ||
| Vietnam | 5.50 | 98,953,541 | 55.58 | 223.78 | 2.46 |
| Yemen | 1.40 | 31,154,867 | 44.94 | 31.27 | 4.48 |
| Zambia | 0.04 | 19,470,234 | 2.05 | 25.87 | 0.15 |
| Zimbabwe | 0.10 | 15,331,428 | 6.52 | 22.04 | 0.45 |
Military expenditure, share of GDP
This first list is a list of countries by military expenditure share of GDP—more specifically, a list of the top 15 countries by percentage share in recent years—the amount spent by a nation on its military as a share of its GDP.
The second list presents this as a share of the general government expenditure. The first list is sourced from the SIPRI for the year 2019 and from Military Balance 2017 published by International Institute for Strategic Studies for the year 2016. The second list is sourced only from the SIPRI for the year 2019.
As a share of GDP
| List by the Stockholm International Peace Research Institute SIPRI Military Expenditure Database[9] (2019) |
List by the International Institute for Strategic Studies Top 15 Defence Budgets 2020[6] | ||||||||||||||||||||||||||||||||||||||||||||||||||||||||||||||||||||||||||||||||||||||||||||||||
|
| ||||||||||||||||||||||||||||||||||||||||||||||||||||||||||||||||||||||||||||||||||||||||||||||||
| * Bold values with an asterisk above are highly uncertain SIPRI estimates.
Italic values are SIPRI estimates. |
Notes
- SIPRI estimate.
- The figures for Saudi Arabia include expenditure for public order and safety and might be slightly overestimated.
See also
| Wikinews has related news: |
References
- Tian, Nan; Fleurant, Aude; Kuimova, Alexandra; Wezeman, Pieter D.; Wezeman, Siemon T. (24 April 2022). "Trends in World Military Expenditure, 2021" (PDF). Stockholm International Peace Research Institute. Archived from the original on 25 April 2022. Retrieved 25 April 2022.
- International Institute for Strategic Studies (25 February 2021). The Military Balance 2021. London: Routledge. ISBN 978-1032012278.
- "Why Russian Military Expenditure Is Much Higher Than Commonly Understood (As Is China's)". War on the Rocks. 16 December 2019. Archived from the original on 12 December 2021. Retrieved 12 December 2021.
- "Russian defense spending is much larger, and more sustainable than it seems". Defensenews. 3 May 2019. Archived from the original on 11 March 2022. Retrieved 12 December 2021.
- "Data for all countries from 1988–2020 in constant (2019) USD (pdf)" (PDF). SIPRI. Archived (PDF) from the original on 28 April 2021. Retrieved 28 April 2021.
- "IISS Military Balance 2021". The Military Balance. International Institute for Strategic Studies. 121 (1): 23–29. January 2021. doi:10.1080/04597222.2021.1868791. S2CID 232050862. Archived from the original on 7 October 2021. Retrieved 25 February 2021.
- "Military Spending by Country 2022". worldpopulationreview.com. Retrieved 15 March 2022.
- "GDP by Country - Worldometer". www.worldometers.info. Retrieved 15 March 2022.
- Excel file here Archived 12 December 2020 at the Wayback Machine | Derived from SIPRI's own webpage Archived 2 May 2019 at the Wayback Machine.
External links
- SIPRI military expenditure database (sipri.org)