Canadian public debt
Canadian government debt (also called Canada's "public debt") is the liabilities of the government sector. For 2020 (the fiscal year ending 31 March 2021), the market value of financial liabilities, or gross debt, was $2,852 billion ($74,747 per capita) for the consolidated Canadian general government (federal, provincial, territorial, and local governments combined).[1] As a ratio of GDP, gross debt was 129.2% in 2020 (GDP was $2,207 billion[2]), the highest level ever recorded.[3] Approximately half, or 66.4% as a ratio of GDP, was debt of the federal government. The increase in debt in 2020 was driven primarily by massive deficits ($325 billion) generated to finance numerous relief measures, notably in the form of transfers to households and subsidies to businesses during the COVID-19 pandemic.[4]
| Public finance |
|---|
 |
|
Changes in government debt over time reflect primarily the impact of past government deficits. A deficit occurs when government spending exceeds revenues. Deficit financing generally creates an intergenerational transfer because the beneficiaries of the goods and services the government provides today through deficit financing typically differ from the individuals responsible for repaying the debt in the future. (An instance where debt would not lead to an intergenerational transfer is if borrowing is used for a one-time purchase of an asset that supplies goods and services in the future which are matched to the debt repayment costs; for example, issuing debt today that is repaid over 50 years to finance a bridge that lasts 50 years.)
Alternative measures of debt
Debt Securities Some types of government liabilities are difficult to measure. One example is government employee pension plans that depend on members' longevity and on a plan's investment returns over many years. By contrast, government debt securities, such as Treasury bills and bonds, are relatively straightforward to value. Also, debt securities comprise the largest component of Canadian government liabilities: in 2020 they were 76.2% of all government liabilities.[5] Looking at just this component, in 2020 the market value of the securities liabilities of the consolidated general government was $2,172 billion, or 98.4% as a ratio of GDP. For just the federal government, the value was $1,165 billion, or 52.8% as a ratio of GDP.[6][7]
Nominal vs. market value of debt The value of government debt securities measured at market prices is most relevant for a purchaser (price varies with changes in market yields). However, the nominal value is more relevant for a government issuing a security because the nominal value indicates the amount owing to the creditor at any moment (i.e. the required future payments discounted at the contractual interest rate).[8] In 2020, the nominal value of debt securities for the consolidated Canadian general government was approximately 6% lower than the market value ($2,057 billion compared to $2,172 billion), while the gross debt was approximately 4% lower ($2,738 billion compared to $2,852 billion).[9]
Net Debt Net government liabilities or net debt is gross debt minus financial assets. The ratio of the market value of net debt to GDP jumped to 70.7% in 2020 (from 55.1% in 2019).[10] The rise in net debt is mainly attributable to the federal government, as its net debt rose by $253 billion to reach $942 billion, or 42.7% as a ratio to GDP (compared to 29.8% in 2019).[11] Net debt takes into account the financial assets governments hold, such as investments to cover the liabilities associated with government employee pension plans. An issue with net debt is that some government assets are difficult to value. Examples of difficult-to-value assets include nonmarketable equity investments, and loans that might never be repaid if the loan-receiving firms become insolvent.
Public accounts vs. national accounts measures of debt The Canadian Department of Finance provides measures of federal and provincial debt on a public accounts basis, using reports from individual governments.[12] An advantage of public accounts numbers is that they can provide detail on government expenditures. However, they are not strictly comparable across jurisdictions. By contrast, debt measured on a national accounts basis (employed above) follows an internationally-agreed standard, in order to facilitate comparisons across countries.
As an example of how the public accounts and national accounts measures differ, consider federal government net debt for calendar year 2018. Measured on a public accounts basis federal net debt was $772 billion, or 34.8% as a ratio of GDP. Measured on a national accounts basis, federal net debt was $596 billion, or 26.9% of GDP.[13] According to the Department of Finance, the difference arises from differences in the reporting of public sector pensions and other future benefits, methodological differences, and timing adjustments.[14]
Revenue and spending
Before the COVID-19 pandemic, the 2019 Canadian federal budget was presented on 19 March 2019 with a total projected revenue of $338.8 billion and projected expenditures of $355.6 billion, resulting in a projected deficit of $19.8 billion (ca. 0.9% of GDP).
In 2020, the federal government's $274 billion deficit accounted for the majority of the Canadian general government deficit (the consolidated provincial, territorial and local governments recorded a deficit of $51 billion).[15] Federal government expenses rose 68.9% from $361 billion to $610 billion. This increase was primality attributable to expenses in response to the COVID-19 pandemic. Business subsidies (including the Canada Emergency Wage Subsidy) jumped 896% to $86 billion, and transfers to households (including the Canada Emergency Response Benefit) more than doubled to $225 billion.[16]
History
Canadian general consolidated government debt as a share of GDP exceeded 100% during the Great Depression of the 1930s and reached 150% following World War II. The ratio fell until the 1970s, and then rose to over 100% in the mid-1990s.[17]
A 1995 editorial in the Wall Street Journal said Canada might need an International Monetary Fund bailout and called Canada "an honorary member of the Third World."[18] Successive years of federal budget deficits in the 1980s and early 1990s, and a rising debt to GDP ratio, led to concerns about debt sustainability. By the mid-1990s the government of newly-elected Prime Minister Jean Chretien undertook a fiscal consolidation that was achieved mainly by big spending reductions. The ratio of spending cuts to tax hikes was seven-to-one. Tax revenues could not be boosted by much partly because Canada's top marginal income tax rate was already around 55%.[18] The federal government's gross debt to GDP ratio fell from the mid-1990s before rising briefly following the financial crisis of 2008-09. It then resumed a downward trend until the pandemic-related spike in 2020.[19]
Provincial government gross debt as a share of GDP has increased fairly steadily since the 1960s.[20] In 2020, for the first time since 2012, federal government gross debt surpassed that of the consolidated provincial-territorial and local governments).[21]
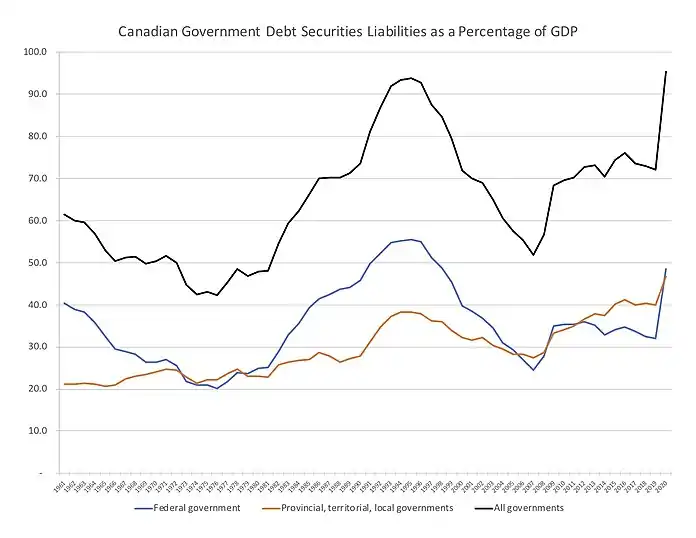
Government bond issues soared in 2020 to finance COVID-19 related spending, as shown in the figure below. Federal government debt securities liabilities rose by $332 billion (to $1074 billion) while provincial, territorial and local rose by $111 billion (to $1034 billion) between the end of 2019 and the third quarter of 2020. As a consequence, the ratio of all government debt securities to GDP jumped to 95.3%, surpassing the 1995 peak of 93.7%.
Foreign ownership
In 1960, 4% of the Canadian government debt was held by foreign investors.[22]
From 2009–2010 to 2013–2014, the amount of the Canadian's debt held by foreign investors passed from 15% to 27% with a peak at 30% in 2012–2013. Even if growing, this level is still lower than or comparable to most G7 countries in 2013-2014 (France, 64%, Germany, 62%, United States, 48%, Italy, 33%, United Kingdom, 29%, and Japan, 8%).[23][24]
Risks that can impact Canadian national debt
Two major risks to federal government debt are identified by Don Drummond, a former Finance Department assistant deputy minister. The first risk is that slow economic growth will reduce government tax revenue and increase the ratio of debt to GDP. Second, Drummond argues the interest rate on public debt will almost certainly rise from the current level which is by far the lowest in post-War experience. With federal government debt crossing the 1 trillion-dollar mark, every one percentage point rise in the effective interest rate adds more than $10 billion per year to the federal deficit.[25]
The International Monetary Fund views exchange rate risk as low for Canada because 90% of general government outstanding marketable debt instruments are denominated in Canadian dollars.[26] For the 10% of debt denominated in foreign currency, there is exchange rate risk since if the Canadian dollar falls in value, a larger quantity of Canadian dollars is needed to repay the debt.
Debt comparison with other countries
The level of government (central, state, or local) responsible for government programs differs across countries. For this reason, international fiscal comparisons are usually made on a total government, national accounts basis. For Canada, total government includes the federal (central), provincial/territorial, and local governments. Another reason to measure debt on a total government basis is that the federal government may be viewed as responsible for the debt of other levels of government.[27] Credit rating agency Fitch said it expects the federal government to provide a province with access to debt markets, as it did early in the coronavirus pandemic.[28] [29] When Newfoundland needed debt repayment assistance in March 2020, it appealed to the federal government.[30] Any aid delivered to one province would reduce the resources the federal government has available for its own debt repayment responsibilities, and to support debt repayment in other provinces.
According to the International Monetary Fund (IMF), Canada's general government gross debt for 2019 was 86.8% as a percentage of GDP.[31] (To allow for consistent international comparisons, Canada's debt data is adjusted to exclude unfunded pension liabilities of government employees' defined-benefit pension plans.[32] Canada's general government debt, including unfunded pension liabilities, would be about 104% of GDP on a gross basis in 2018.[33]) The IMF says in 2018 Canada's general government gross debt would be 73.7% of GDP, just below the average debt level of economies with AAA ratings, if accounts payable are excluded to make its debt value internationally comparable.[33]
The general government gross debt to GDP ratio for countries the IMF classifies as Advanced economies that have a population of at least 5 million is shown in the table below. In 2020, Canada had the fourth highest level of gross public debt as a percent of GDP among the G7 – lower than Japan, Italy and the United States, but higher than Germany, the United Kingdom and France.
General Government Gross Debt, Percent of GDP
| 2019 | 2020 | |
| Japan | 235.4 | 254.1 |
| Greece | 184.9 | 211.2 |
| Italy | 134.6 | 155.8 |
| Singapore | 129.0 | 154.9 |
| Portugal | 116.6 | 135.2 |
| United States | 108.5 | 133.9 |
| Spain | 95.5 | 119.9 |
| Canada | 86.8 | 117.5 |
| France | 97.6 | 115.1 |
| Belgium | 98.1 | 114.1 |
| United Kingdom | 85.2 | 104.5 |
| Austria | 70.5 | 83.2 |
| Israel | 59.5 | 72.0 |
| Finland | 59.5 | 69.5 |
| Germany | 59.2 | 69.1 |
| Slovak Republic | 48.2 | 60.3 |
| Ireland | 57.3 | 58.5 |
| Australia | 46.6 | 57.3 |
| Netherlands | 47.4 | 52.5 |
| Korea | 42.1 | 47.9 |
| New Zealand | 32.0 | 43.6 |
| Switzerland | 39.8 | 42.4 |
| Denmark | 33.6 | 42.1 |
| Norway | 40.9 | 41.4 |
| Czech Republic | 30.0 | 37.8 |
| Sweden | 34.9 | 37.3 |
Source: International Monetary Fund, World Economic Outlook Database, October 2021. Numbers for 2020 are estimates for Australia, Austria, Czech Republic, Israel, Japan, Korea, Netherlands, Slovak Republic, and Switzerland.
Future expectations of the debt
In its staff report released in 2019, before the COVID-19 pandemic, the International Monetary Fund says the Canadian federal government experienced favorable economic conditions since the 2018 budget that led to sizeable windfall gains: higher than anticipated revenue collections, lower transfers to households, and lower projected interest rates. On the other hand, pressures loom large on the horizon at the provincial level, with annual health care spending growth expected to rise from 3% to 4½% over a 10-20 year timeframe, contributing to rising net debt to GDP ratios by around 2025.[34]
Yves Giroux, the Parliamentary Budget Officer (PBO), finds fiscal policy is sustainable over the long term for the federal government, but is not sustainable for seven of ten provincial governments. The deterioration in provincial government finances over the long term is due chiefly to the negative impact of the pandemic, lower oil prices, and rising health care costs from population ageing. When the PBO defines fiscal policy as unsustainable, he means changes in current fiscal policy are necessary to avoid excessive growth in government debt. (The PBO analysis assumes the pandemic budgetary response measures are temporary and are withdrawn as currently scheduled. Fiscal policy then reverts to its pre-crisis setting with no new programs or extensions.)[35]
Some critics have raised concerns about the rising cost of servicing the Canadian government debt, saying that, despite historically low interest rates, interest payments on the public debt are expected to increase by 59.4% in 2021.[36]
Public debt of Canadian provinces
The total financial liabilities or gross debt of the Canadian consolidated provincial, territorial and local governments (PTLG) was $1,391 billion in 2020 (the fiscal year ending 31 March 2021), as shown in the table below. Debt rose in 2020, as decreased revenues and increased program expenditures due to COVID-19 resulted in additional borrowing, mainly in the form of provincial bond issuances.[37]
The value of provincial outstanding debt securities liabilities varies from 28.7% expressed as a percentage of GDP for British Columbia, to 75.8% for Manitoba. Debt securities comprise the largest component of gross debt and are relatively straightforward to measure. (Another major component of gross debt, government employee pension plan liabilities, is more difficult to measure as it varies with a plan's investment returns and member longevity, for example.)
Provincial government gross debt is a substantial proportion of the $2.738 trillion of public debt obligations of Canadians. At $1.391 trillion, gross debt of the consolidated provincial, territorial and local governments (PTLG) almost equals the federal government's gross debt of $1.426 trillion. Similarly, the outstanding debt securities issued by the PTLGs, at 44.9% as a share of GDP, is close to the federal government's 51.0% share of GDP.
| Data for fiscal year 2020. | Gross debt ($billions) | Gross debt as a share of GDP | Debt securities ($billions) | Debt securities as a share of GDP |
| British Columbia | 120.0 | 38.8 | 88.6 | 28.7 |
| Alberta | 174.4 | 59.2 | 128.3 | 43.5 |
| Saskatchewan | 46.5 | 59.7 | 25.8 | 33.1 |
| Manitoba | 68.8 | 94.4 | 55.3 | 75.8 |
| Ontario | 507.6 | 58.6 | 414.1 | 47.8 |
| Quebec | 407.4 | 90.7 | 238.9 | 53.2 |
| New Brunswick | 28.6 | 76.2 | 22.7 | 60.4 |
| Nova Scotia | 26.3 | 56.1 | 17.2 | 36.7 |
| Prince Edward Island | 3.7 | 48.6 | 2.6 | 34.2 |
| Newfoundland and Labrador | 24.8 | 78.6 | 16.8 | 53.1 |
| Consolidated provincial-territorial and local governments | 1,391.2 | 63.0 | 990.4 | 44.9 |
| Federal government | 1,426.2 | 64.6 | 1,124.8 | 51.0 |
| Consolidated Canadian general government | 2,737.6 | 124.1 | 2,057.5 | 93.2 |
Source: Statistics Canada, Canadian government finance statistics, statement of operations and balance sheet for consolidated governments, Table 10-10-0147-01, https://doi.org/10.25318/1010014701-eng; and Canadian government finance statistics for the federal government, 10-10-0016-01, https://doi.org/10.25318/1010001601-eng. Gross debt from "Memorandum items, liabilities at nominal value." Debt securities at nominal value is calculated as debt securities at market value - (liabilities at market value - liabilities at nominal value). Calculations as a percentage of gross domestic product (GDP) are GDP in 2020 at current market prices, expenditure-based, available in Statistics Canada, Table 36-10-0222-01, https://doi.org/10.25318/3610022201-eng.
___________________________________________________________________________________________________
Data for the provincial governments are consolidated. Consolidation is a method used to present one overarching statistic for a province that eliminates all transactions and debtor-creditor relationships among different government units within a province. These units include the provincial government, health and social service institutions, universities and colleges, municipalities and other local public administrations, and school boards. Consolidated data can be compared across provinces because consolidation takes into account differences in provincial administrative structures and government service delivery.[38]
Consolidated data for the Canadian general government combines federal government data with provincial, territorial and local governments, but excludes data for the Canada Pension Plan and Quebec Pension Plan.[39]
In the table above, debt securities are measured at nominal value, rather than market prices. The nominal value is most relevant to the issuer because it indicates the amount that the debtor owes to the creditor at any moment.[40] In 2020, the market value of debt securities for the consolidated Canadian general government was approximately 6% higher than the nominal value ($2,171.7 billion compared to $2,057.5 billion.)[41]
Calculating and projecting the debt
In 2002–2003, Canada changed its calculation for net debt. Until then, net debt was defined as the total liabilities minus total assets. Now, it is the total liabilities minus financial assets. The government prefers the concept of "accumulated deficit," which corresponds to the old definition of net debt.
See also
General:
International:
Notes
References
- Statistics Canada, The Daily (22 November 2021). "COVID-19: Historic deficit for the Canadian general government". Archived from the original on 23 November 2021.
- Statistics Canada. "Table 36-10-0222-01 Gross domestic product, expenditure-based, provincial and territorial, annual". Archived from the original on 8 November 2018.
- Statistics Canada, The Daily (22 November 2021). "COVID-19: Historic deficit for the Canadian general government". Archived from the original on 23 November 2021.
- Statistics Canada, The Daily (22 November 2021). "COVID-19: Historic deficit for the Canadian general government". Archived from the original on 23 November 2021.
- Statistics Canada. "Table 10-10-0147-01 Canadian government finance statistics (CGFS), statement of operations and balance sheet for consolidated governments".
- Statistics Canada, Table 10-10-0147-01. "Canadian government finance statistics (CGFS), statement of operations and balance sheet for consolidated governments".
- Statistics Canada. "Table 36-10-0222-01 Gross domestic product, expenditure-based, provincial and territorial, annual".
{{cite web}}: CS1 maint: url-status (link) - Statistics Canada. "Footnote to 'Memorandum items, liabilities at nominal value' Table 10-10-0147-01, Canadian Government Finance Statistics (CGFS), statement of operations and balance sheet for consolidated governments".
{{cite web}}: CS1 maint: url-status (link) - Statistics Canada. "Table 10-10-0147-01, Canadian government finance statistics (CGFS), statement of operations and balance sheet for consolidated governments".
{{cite web}}: CS1 maint: url-status (link) - Statistics Canada, The Daily (22 November 2021). "COVID-19: Historic deficit for the Canadian general government". Archived from the original on 23 November 2021.
- Statistics Canada, The Daily (22 November 2021). "COVID-19: Historic deficit for the Canadian general government". Archived from the original on 23 November 2021.
- Department of Finance Canada. "Fiscal Reference Tables". Government of Canada. Archived from the original on 7 January 2020.
- Government of Canada, Department of Finance (5 November 2019). "Tables 8 and 47, Annual Financial Report of the Government of Canada Fiscal Year 2018-19".
- Government of Canada, Department of Finance (5 November 2019). "Annual Financial Report of the Government of Canada Fiscal Year 2018-19".
- Statistics Canada, The Daily (22 November 2021). "COVID-19: Historic deficit for the Canadian general government". Archived from the original on 23 November 2021.
- Statistics Canada, The Daily (22 November 2021). "COVID-19: Historic deficit for the Canadian general government". Archived from the original on 23 November 2021.
- Tombe, Trevor (September 2020). "Figure 1, Provincial Debt Sustainability in Canada: Demographics, Federal Transfers, and COVID-19" (PDF).
- Financial Post, Randall Palmer and Louise Egan (21 November 2011). "Lessons from Canada's 'basket case' moment". Retrieved 8 December 2020.
- Tombe, Trevor (September 2020). "Provincial Debt Sustainability in Canada: Demographics, Federal Transfers and COVID-19" (PDF). Archived (PDF) from the original on 28 September 2020.
- Tombe, Trevor (September 2020). "Provincial Debt Sustainability in Canada: Demographics, Federal Transfers, and COVID-19" (PDF). Retrieved 8 December 2020.
- Statistics Canada, The Daily (22 November 2021). "COVID-19: Historic deficit for the Canadian general government". Archived from the original on 23 November 2021.
- Safaraian, A.E. The Hegemony of International Business, 1945–1970, Volume IV: Foreign Ownership of Canadian Industry. New York: Routledge, 1973. 12.
- Department of Finance Canada, Debt Management Report 2011–2012, http://www.fin.gc.ca/dtman/2011-2012/dmr-rgd1201-eng.asp#Toc340732968
- Department of Finance Canada, Debt Management Report 2013–2014, http://www.fin.gc.ca/dtman/2013-2014/dmr-rgd1401-eng.asp#toc12
- Drummond, Don (20 October 2020). "Canada's Foggy Economic and Fiscal Future". C. D. Howe Institute. Archived from the original on 21 October 2020.
- International Monetary Fund (24 June 2019). "Canada: 2019 Article IV Consultation Staff Report, page 52". Archived from the original on 5 August 2019.
- Robson, William; Laurin, Alexandre (27 October 2020). "Adaptability, accountability and sustainability: Intergovernmental fiscal arrangements in Canada, Chapter 6 in Ageing and Fiscal Challenges across Levels of Government". OECD-ilibrary.org. p. 20 of 23. Archived from the original on 11 December 2020.
- Brethour, Patrick (28 June 2021). "Fitch downgrades B.C.'s credit rating partly because of federal debt". The Globe and Mail. Archived from the original on 28 June 2021.
- Fitch Ratings (24 June 2021). "Fitch Affirms Province of Ontario IDR at 'AA-'; Outlook Stable". Archived from the original on 9 July 2021.
- CBC News (20 March 2020). "Out of time / How a pandemic and an oil crash almost sank Newfoundland and Labrador".
- International Monetary Fund (October 2021). "World Economic Outlook Database". Archived from the original on 12 October 2021.
- International Monetary Fund (October 2020). "World Economic Outlook, October 2020".
- International Monetary Fund (24 June 2019). "Annex II, Country Report: Canada".
- International Monetary Fund (24 June 2019). "Canada: 2019 Article IV Consultation Staff Report, pages 14-15". Archived from the original on 5 August 2019.
- Giroux, Yves (6 November 2020). "Parliamentary Budget Officer, Fiscal Sustainability Report 2020: Update" (PDF). Archived (PDF) from the original on 6 November 2020.
- "GOLDSTEIN: Servicing public debt eroding nation's finances -- report". torontosun. Retrieved 25 March 2022.
- Statistics Canada, The Daily (11 September 2020). "National balance sheet and financial flow accounts, second quarter 2020". Archived from the original on 13 September 2020.
- Statistics Canada, The Daily (18 November 2020). "'Note to readers' in 'Largest deficit in seven years in 2019: full impact of pandemic yet to be seen'". Archived from the original on 18 November 2020.
- Statistics Canada, The Daily (29 November 2021). ""Note to Readers" in "COVID-19: Historic deficit for the Canadian general government"". Archived from the original on 22 November 2021.
- Statistics Canada. "Footnote to 'Memorandum items, liabilities at nominal value' Table 10-10-0147-01, Canadian Government Finance Statistics (CGFS), statement of operations and balance sheet for consolidated governments".
{{cite web}}: CS1 maint: url-status (link) - Statistics Canada. "Table 10-10-0147-01, Canadian government finance statistics (CGFS), statement of operations and balance sheet for consolidated governments".
{{cite web}}: CS1 maint: url-status (link)