Casiguran, Sorsogon
Casiguran, officially the Municipality of Casiguran, is a 4th class municipality in the province of Sorsogon, Philippines. According to the 2020 census, it has a population of 35,602 people. [3]
Casiguran | |
|---|---|
| Municipality of Casiguran | |
 Municipal hall | |
 Flag | |
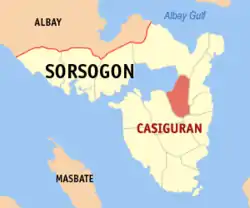 Map of Sorsogon with Casiguran highlighted | |
OpenStreetMap 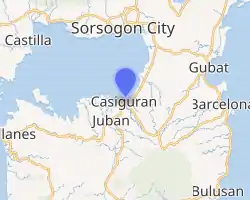 | |
.svg.png.webp) Casiguran Location within the Philippines | |
| Coordinates: 12°52′23″N 124°00′29″E | |
| Country | Philippines |
| Region | Bicol Region |
| Province | Sorsogon |
| District | 1st district |
| Founded | October 7, 1600 |
| Barangays | 25 (see Barangays) |
| Government | |
| • Type | Sangguniang Bayan |
| • Mayor | Jose Edwin B. Hamor |
| • Vice Mayor | Dennis Alfonso L. Escudero |
| • Representative | Evelina G. Escudero |
| • Municipal Council | Members |
| • Electorate | 21,359 voters (2019) |
| Area | |
| • Total | 87.13 km2 (33.64 sq mi) |
| Elevation | 26 m (85 ft) |
| Highest elevation | 162 m (531 ft) |
| Lowest elevation | 0 m (0 ft) |
| Population | |
| • Total | 35,602 |
| • Density | 410/km2 (1,100/sq mi) |
| • Households | 7,088 |
| Economy | |
| • Income class | 4th municipal income class |
| • Poverty incidence | 30.58% (2018)[4] |
| • Revenue | ₱131,379,326.18 (2020) |
| • Assets | ₱419,954,210.35 (2020) |
| • Expenditure | ₱130,769,266.84 (2020) |
| • Liabilities | ₱116,845,962.75 (2020) |
| Service provider | |
| • Electricity | Sorsogon 1 Electric Cooperative (SORECO 1) |
| Time zone | UTC+8 (PST) |
| ZIP code | 4702 |
| PSGC | |
| IDD : area code | +63 (0)56 |
| Native languages | Sorsogon Tagalog |
| Website | www |
History
Established in the year 1600, Casiguran was the first missionary parish of Sorsogon. When the Spaniards first set foot in this part of Luzon in the 1570s, Casiguran was considered as their center of Kabikolan.
In 1583, the Franciscan missionaries took over the evangelization work started by the Augustinians.
The name Casiguran is believed to come from the Bicol phrase kasi gurang, meaning, mostly old, pointing to the fact that it was the first parish and therefore to be considered to be populated by senior inhabitants.
A legend persists that the town was named "Casiguran" because, during the Spanish times, all the young men and ladies were kept hidden and only old people can be seen in the town. The reason of the townspeople for this is that the young people are being exploited by the Spaniards, thus, kept them in hiding. One day, Americans set foot in the soil of the town and asked for its name. The people did not understand their language. Thinking that the Americans were asking why there are no young people, the people answered, "kasi gurang" (because only old people live there). The Americans thought that "Kasi gurang" was the name of the town. They left repeating the words "kasi gurang" as not to forget them, until it came to be called as "Casiguran."
Geography
It is located at the coast of Sorsogon Bay, at the south of Luzon island, making it a suburb of neighboring Sorsogon City.
Barangays
Casiguran is politically subdivided into 25 barangays.
Climate
| Climate data for Casiguran, Sorsogon | |||||||||||||
|---|---|---|---|---|---|---|---|---|---|---|---|---|---|
| Month | Jan | Feb | Mar | Apr | May | Jun | Jul | Aug | Sep | Oct | Nov | Dec | Year |
| Average high °C (°F) | 27 (81) |
28 (82) |
29 (84) |
31 (88) |
31 (88) |
30 (86) |
29 (84) |
29 (84) |
29 (84) |
29 (84) |
29 (84) |
28 (82) |
29 (84) |
| Average low °C (°F) | 22 (72) |
21 (70) |
22 (72) |
23 (73) |
24 (75) |
25 (77) |
25 (77) |
25 (77) |
25 (77) |
24 (75) |
23 (73) |
23 (73) |
24 (74) |
| Average precipitation mm (inches) | 65 (2.6) |
44 (1.7) |
42 (1.7) |
39 (1.5) |
87 (3.4) |
150 (5.9) |
184 (7.2) |
153 (6.0) |
163 (6.4) |
154 (6.1) |
127 (5.0) |
100 (3.9) |
1,308 (51.4) |
| Average rainy days | 13.9 | 9.2 | 11.0 | 12.5 | 19.6 | 24.3 | 26.5 | 25.0 | 25.5 | 24.4 | 19.4 | 15.1 | 226.4 |
| Source: Meteoblue (Use with caution: this is modeled/calculated data, not measured locally.) [5] | |||||||||||||
Demographics
| Year | Pop. | ±% p.a. |
|---|---|---|
| 1903 | 7,873 | — |
| 1918 | 12,394 | +3.07% |
| 1939 | 12,412 | +0.01% |
| 1948 | 12,940 | +0.46% |
| 1960 | 15,043 | +1.26% |
| 1970 | 20,054 | +2.91% |
| 1975 | 18,224 | −1.90% |
| 1980 | 21,790 | +3.64% |
| 1990 | 22,277 | +0.22% |
| 1995 | 25,804 | +2.79% |
| 2000 | 28,057 | +1.81% |
| 2007 | 30,165 | +1.00% |
| 2010 | 30,995 | +0.99% |
| 2015 | 32,842 | +1.11% |
| 2020 | 35,602 | +1.60% |
| Source: Philippine Statistics Authority [6] [7] [8][9] | ||
Economy
| Poverty Incidence of Casiguran | |
| Source: Philippine Statistics Authority[10][11][12][13][14][15][16] | |
References
- Municipality of Casiguran | (DILG)
- "2015 Census of Population, Report No. 3 – Population, Land Area, and Population Density" (PDF). Philippine Statistics Authority. Quezon City, Philippines. August 2016. ISSN 0117-1453. Archived (PDF) from the original on May 25, 2021. Retrieved July 16, 2021.
- Census of Population (2020). "Region V (Bicol Region)". Total Population by Province, City, Municipality and Barangay. PSA. Retrieved 8 July 2021.
- "PSA Releases the 2018 Municipal and City Level Poverty Estimates". Philippine Statistics Authority. 15 December 2021. Retrieved 22 January 2022.
- "Casiguran, Sorsogon : Average Temperatures and Rainfall". Meteoblue. Retrieved 29 December 2018.
- Census of Population (2015). "Region V (Bicol Region)". Total Population by Province, City, Municipality and Barangay. PSA. Retrieved 20 June 2016.
- Census of Population and Housing (2010). "Region V (Bicol Region)". Total Population by Province, City, Municipality and Barangay. NSO. Retrieved 29 June 2016.
- Censuses of Population (1903–2007). "Region V (Bicol Region)". Table 1. Population Enumerated in Various Censuses by Province/Highly Urbanized City: 1903 to 2007. NSO.
- "Province of Sorsogon". Municipality Population Data. Local Water Utilities Administration Research Division. Retrieved 17 December 2016.
- "Poverty incidence (PI):". Philippine Statistics Authority. Retrieved 28 December 2020.
- https://psa.gov.ph/sites/default/files/NSCB_LocalPovertyPhilippines_0.pdf; publication date: 29 November 2005; publisher: Philippine Statistics Authority.
- https://psa.gov.ph/sites/default/files/2003%20SAE%20of%20poverty%20%28Full%20Report%29_1.pdf; publication date: 23 March 2009; publisher: Philippine Statistics Authority.
- https://psa.gov.ph/sites/default/files/2006%20and%202009%20City%20and%20Municipal%20Level%20Poverty%20Estimates_0_1.pdf; publication date: 3 August 2012; publisher: Philippine Statistics Authority.
- https://psa.gov.ph/sites/default/files/2012%20Municipal%20and%20City%20Level%20Poverty%20Estima7tes%20Publication%20%281%29.pdf; publication date: 31 May 2016; publisher: Philippine Statistics Authority.
- https://psa.gov.ph/sites/default/files/City%20and%20Municipal-level%20Small%20Area%20Poverty%20Estimates_%202009%2C%202012%20and%202015_0.xlsx; publication date: 10 July 2019; publisher: Philippine Statistics Authority.
- "PSA Releases the 2018 Municipal and City Level Poverty Estimates". Philippine Statistics Authority. 15 December 2021. Retrieved 22 January 2022.
External links
| Wikimedia Commons has media related to Casiguran, Sorsogon. |
- Casiguran Profile at PhilAtlas.com
- Philippine Standard Geographic Code
- Philippine Census Information
- Local Governance Performance Management System
Places adjacent to Casiguran, Sorsogon | ||||||||||||||||
|---|---|---|---|---|---|---|---|---|---|---|---|---|---|---|---|---|
| ||||||||||||||||