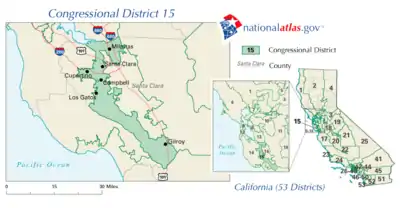
California's 15th congressional district
California's 15th congressional district is a congressional district in the U.S. state of California. The district is currently represented by Democrat Eric Swalwell. The district currently covers most of eastern and southwestern Alameda County as well as part of Contra Costa County. Cities and CDPs in the district include Castro Valley, Dublin, Hayward, Livermore, Pleasanton, Sunol, and Union City; most of San Ramon; and parts of Danville and Fremont.
| California's 15th congressional district | |||
|---|---|---|---|
.tif.png.webp) California's 15th congressional district since January 3, 2013 | |||
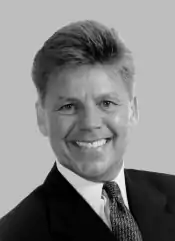
| Representative |
| ||
| Population (2019) | 782,312 | ||
| Median household income | $125,018[1] | ||
| Ethnicity |
| ||
| Cook PVI | D+22[2] | ||
Prior to redistricting by the California Citizens Redistricting Commission in 2011, the 15th wrapped around San Jose on the north and west, extending south to include much of Gilroy. That area is now split between the 17th, 18th, and 19th districts. The current 15th predominantly consists of portions of the former 13th, 11th, and 10th districts.
Election results from statewide races
| Year | U.S. President | U.S. Senator (Class 1) | U.S. Senator (Class 3) | Governor |
|---|---|---|---|---|
| 1992 | Clinton 46.3 – 30.3% | Feinstein 59.3 – 33.4% | Boxer 51.1 – 38.3% | |
| 1994 | Feinstein 52.3 – 39.2% | Wilson 51.3 – 43.3% | ||
| 1996 | Clinton 52.7 – 35.2% | |||
| 1998 | Boxer 54.5 – 41.3% | Davis 60.8 – 35% | ||
| 2000 | Gore 56.7 – 37.8%[3] | Feinstein 54.6 – 39.8%[4] | ||
| 2002 | Davis 55.0 – 33.4%[5] | |||
| 2003 | Recall: No 56.0 – 44.0%[6][7] | |||
| Schwarzenegger 40.8 – 37.2% | ||||
| 2004 | Kerry 62.9 – 35.9%[8] | Boxer 64.9 – 30.8%[9] | ||
| 2006 | Feinstein 68.5 – 26.2%[10] | Schwarzenegger 53.6 – 41.3%[11] | ||
| 2008 | Obama 68.4 – 29.7% [12] | |||
| 2010 | Boxer 61.8 – 33.0% | Brown 59.8 – 36.2% | ||
| 2012 | Obama 68.0 – 29.8% | Feinstein 70.7 – 29.3% | ||
| 2014 | Brown 69.7 – 30.3% | |||
| 2016 | Clinton 69.9 – 24.4% | Harris 69.8 – 30.2% | ||
| 2018 | Feinstein 57.3 – 42.7% | Newsom 69 – 31% | ||
| 2020 | Biden 71.5 – 26.4% |
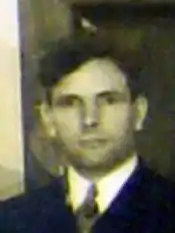
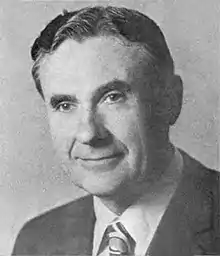
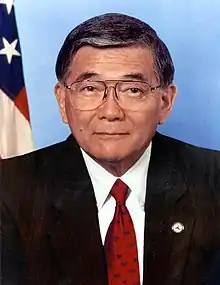
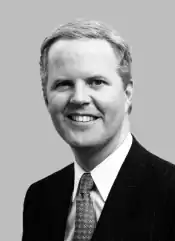
List of members representing the district
.jpg.webp)
.jpg.webp)
Election results
1932
| Party | Candidate | Votes | % | ||
|---|---|---|---|---|---|
| Republican | William I. Traeger | 67,390 | 52.8 | ||
| Democratic | John M. Costello | 57,518 | 45.1 | ||
| No party | Errol Shour (write-in) | 2,721 | 2.1 | ||
| Total votes | 127,663 | 100.0 | |||
| Turnout | |||||
| Republican win (new seat) | |||||
1934
| Party | Candidate | Votes | % | |||
|---|---|---|---|---|---|---|
| Democratic | John M. Costello | 67,247 | 50.5 | |||
| Republican | William I. Traeger (Incumbent) | 65,858 | 49.5 | |||
| Total votes | 133,161 | 100.0 | ||||
| Turnout | ||||||
| Democratic gain from Republican | ||||||
1936
| Party | Candidate | Votes | % | |
|---|---|---|---|---|
| Democratic | John M. Costello (Incumbent) | 99,107 | 69.0 | |
| Republican | Ernest Sawyer | 44,559 | 31.0 | |
| Total votes | 143,718 | 100.0 | ||
| Turnout | ||||
| Democratic hold | ||||
1938
| Party | Candidate | Votes | % | |
|---|---|---|---|---|
| Democratic | John M. Costello (Incumbent) | 83,086 | 60.1 | |
| Republican | O. D. Thomas | 51,483 | 37.3 | |
| Communist | Emil Freed | 2,951 | 2.1 | |
| Total votes | 138,132 | 100.0 | ||
| Turnout | ||||
| Democratic hold | ||||
1940
| Party | Candidate | Votes | % | |
|---|---|---|---|---|
| Democratic | John M. Costello (Incumbent) | 94,435 | 56.2 | |
| Republican | Norris Nelson | 71,667 | 42.6 | |
| Communist | Emil Freed | 2,004 | 1.2 | |
| Total votes | 168,155 | 100.0 | ||
| Turnout | ||||
| Democratic hold | ||||
1942
| Party | Candidate | Votes | % | |
|---|---|---|---|---|
| Democratic | John M. Costello (Incumbent) | 88,798 | 86.1 | |
| Prohibition | B. Tarkington Dowden | 10,185 | 9.9 | |
| Communist | Philip Gardner | 3,989 | 3.9 | |
| Total votes | 103,094 | 100.0 | ||
| Turnout | ||||
| Democratic hold | ||||
1944
| Party | Candidate | Votes | % | |||
|---|---|---|---|---|---|---|
| Republican | Gordon L. McDonough | 100,305 | 56.6 | |||
| Democratic | Hal Styles | 73,655 | 41.6 | |||
| Prohibition | Johannes Nielson-Lange | 2,694 | 1.5 | |||
| Total votes | 177,081 | 100.0 | ||||
| Turnout | ||||||
| Republican gain from Democratic | ||||||
1946
| Party | Candidate | Votes | % | |
|---|---|---|---|---|
| Republican | Gordon L. McDonough (Incumbent) | 106,020 | 99.4 | |
| Turnout | 106,628 | |||
| Republican hold | ||||
1948
| Party | Candidate | Votes | % | |
|---|---|---|---|---|
| Republican | Gordon L. McDonough (Incumbent) | 131,933 | 83.0 | |
| Progressive | Maynard Omerberg | 27,007 | 17.0 | |
| Total votes | 159,031 | 100.0 | ||
| Turnout | ||||
| Republican hold | ||||
1950
| Party | Candidate | Votes | % | |
|---|---|---|---|---|
| Republican | Gordon L. McDonough (Incumbent) | 112,704 | 87.1 | |
| Progressive | Jeanne Cole | 16,559 | 12.8 | |
| Total votes | 129,352 | 100.0 | ||
| Turnout | ||||
| Republican hold | ||||
1952
| Party | Candidate | Votes | % | |
|---|---|---|---|---|
| Republican | Gordon L. McDonough (Incumbent) | 142,545 | 99.7 | |
| Turnout | 142,932 | |||
| Republican hold | ||||
1954
| Party | Candidate | Votes | % | |
|---|---|---|---|---|
| Republican | Gordon L. McDonough (Incumbent) | 77,651 | 56.9 | |
| Democratic | Frank O'Sullivan | 58,785 | 43.1 | |
| Total votes | 136,445 | 100.0 | ||
| Turnout | ||||
| Republican hold | ||||
1956
| Party | Candidate | Votes | % | |
|---|---|---|---|---|
| Republican | Gordon L. McDonough (Incumbent) | 97,182 | 57.9 | |
| Democratic | Emery Petty | 70,681 | 42.1 | |
| Total votes | 167,865 | 100.0 | ||
| Turnout | ||||
| Republican hold | ||||
1958
| Party | Candidate | Votes | % | |
|---|---|---|---|---|
| Republican | Gordon L. McDonough (Incumbent) | 77,267 | 52.0 | |
| Democratic | Emery Petty | 71,192 | 48.0 | |
| Total votes | 148,482 | 100.0 | ||
| Turnout | ||||
| Republican hold | ||||
1960
| Party | Candidate | Votes | % | |
|---|---|---|---|---|
| Republican | Gordon L. McDonough (Incumbent) | 89,234 | 51.3 | |
| Democratic | Norman Martell | 84,650 | 48.5 | |
| Total votes | 174,035 | 100.0 | ||
| Turnout | ||||
| Republican hold | ||||
1962
| Party | Candidate | Votes | % | |
|---|---|---|---|---|
| Democratic | John J. McFall (Incumbent) | 97,322 | 70 | |
| Republican | Clifford B. Bull | 41,726 | 30 | |
| Total votes | 139,048 | 100 | ||
| Turnout | ||||
| Democratic hold | ||||
1964
| Party | Candidate | Votes | % | |
|---|---|---|---|---|
| Democratic | John J. McFall (Incumbent) | 109,560 | 70.9 | |
| Republican | Kenneth Gibson | 44,977 | 29.1 | |
| Total votes | 154,537 | 100.0 | ||
| Turnout | ||||
| Democratic hold | ||||
1966
| Party | Candidate | Votes | % | |
|---|---|---|---|---|
| Democratic | John J. McFall (Incumbent) | 81,733 | 57 | |
| Republican | Sam Van Dyken | 61,550 | 43 | |
| Total votes | 143,283 | 100 | ||
| Turnout | ||||
| Democratic hold | ||||
1968
| Party | Candidate | Votes | % | |
|---|---|---|---|---|
| Democratic | John J. McFall (Incumbent) | 85,761 | 53.8 | |
| Republican | Sam Van Dyken | 73,685 | 46.2 | |
| Total votes | 159,446 | 100.0 | ||
| Turnout | ||||
| Democratic hold | ||||
1970
| Party | Candidate | Votes | % | |
|---|---|---|---|---|
| Democratic | John J. McFall (Incumbent) | 98,442 | 63.1 | |
| Republican | Sam Van Dyken | 55,546 | 35.6 | |
| American Independent | Francis E. "Gill" Gillings | 1,994 | 1.3 | |
| Total votes | 155,982 | 100.0 | ||
| Turnout | ||||
| Democratic hold | ||||
1972
| Party | Candidate | Votes | % | |
|---|---|---|---|---|
| Democratic | John J. McFall (Incumbent) | 145,273 | 100.0 | |
| Turnout | ||||
| Democratic hold | ||||
1974
| Party | Candidate | Votes | % | |
|---|---|---|---|---|
| Democratic | Bernice F. Sisk (Incumbent) | 80,205 | 72 | |
| Republican | Carol Harner | 31,361 | 28 | |
| Total votes | 111,566 | 100 | ||
| Turnout | ||||
| Democratic hold | ||||
1976
| Party | Candidate | Votes | % | |
|---|---|---|---|---|
| Democratic | Bernice F. Sisk (Incumbent) | 92,735 | 72.2 | |
| Republican | Carol Harner | 35,700 | 27.8 | |
| Total votes | 128,435 | 100.0 | ||
| Turnout | ||||
| Democratic hold | ||||
1978
| Party | Candidate | Votes | % | |
|---|---|---|---|---|
| Democratic | Tony Coelho | 75,212 | 60.1 | |
| Republican | Chris Patterakis | 49,914 | 39.9 | |
| Total votes | 125,126 | 100.0 | ||
| Turnout | ||||
| Democratic hold | ||||
1980
| Party | Candidate | Votes | % | |
|---|---|---|---|---|
| Democratic | Tony Coelho (Incumbent) | 108,072 | 71.8 | |
| Republican | Ron Schwartz | 37,895 | 25.2 | |
| Libertarian | Michael L. Pullen | 4,524 | 3.0 | |
| Total votes | 150,491 | 100.0 | ||
| Turnout | ||||
| Democratic hold | ||||
1982
| Party | Candidate | Votes | % | |
|---|---|---|---|---|
| Democratic | Tony Coelho (Incumbent) | 86,022 | 63.7 | |
| Republican | Ed Bates | 45,948 | 34.0 | |
| Libertarian | Stephen L. Gerringer | 3,073 | 2.3 | |
| Total votes | 135,043 | 100.0 | ||
| Turnout | ||||
| Democratic hold | ||||
1984
| Party | Candidate | Votes | % | |
|---|---|---|---|---|
| Democratic | Tony Coelho (Incumbent) | 109,590 | 65.5 | |
| Republican | Carol Harner | 54,730 | 32.7 | |
| Libertarian | Richard M. Harris | 3,086 | 1.8 | |
| Total votes | 167,406 | 100.0 | ||
| Turnout | ||||
| Democratic hold | ||||
1986
| Party | Candidate | Votes | % | |
|---|---|---|---|---|
| Democratic | Tony Coelho (Incumbent) | 93,600 | 71.0 | |
| Republican | Carol Harner | 35,793 | 27.2 | |
| Libertarian | Richard M. Harris | 2,382 | 1.8 | |
| Total votes | 131,775 | 100.0 | ||
| Turnout | ||||
| Democratic hold | ||||
1988
| Party | Candidate | Votes | % | |
|---|---|---|---|---|
| Democratic | Tony Coelho (Incumbent) | 118,710 | 69.8 | |
| Republican | Carol Harner | 47,957 | 28.2 | |
| Libertarian | Richard M. Harris | 3,526 | 2.1 | |
| Total votes | 170,193 | 100.0 | ||
| Total votes | 70,753 | 41.6 | ||
| Turnout | ||||
| Democratic hold | ||||
1989 (Special)
| Party | Candidate | Votes | % | |
|---|---|---|---|---|
| Democratic | Gary Condit | 57.1 | ||
| Republican | Claire L. Berryhill | 35.0 | ||
| Republican | Robert J. Weimer | 3.3 | ||
| Republican | Cliff Burris | 2.6 | ||
| Libertarian | Roy Shrimp | 0.9 | ||
| Republican | Chris Patterakis | 0.4 | ||
| Republican | David M. "Dave" Williams | 0.4 | ||
| Republican | Jack E. McCoy | 0.2 | ||
| Total votes | 100.0 | |||
| Turnout | ||||
| Democratic hold | ||||
1990
| Party | Candidate | Votes | % | |
|---|---|---|---|---|
| Democratic | Gary Condit (Incumbent) | 97,147 | 66.2 | |
| Republican | Cliff Burris | 49,634 | 33.8 | |
| Total votes | 146,781 | 100.0 | ||
| Turnout | ||||
| Democratic hold | ||||
1992
| Party | Candidate | Votes | % | |
|---|---|---|---|---|
| Democratic | Norm Mineta (Incumbent) | 168,617 | 63.5 | |
| Republican | Robert Wick | 82,875 | 31.2 | |
| Libertarian | Duggan Dieterly | 13,293 | 5.0 | |
| No party | Futrell (write-in) | 585 | 0.2 | |
| Total votes | 265,370 | 100.0 | ||
| Turnout | ||||
| Democratic hold | ||||
1994
| Party | Candidate | Votes | % | |
|---|---|---|---|---|
| Democratic | Norm Mineta (Incumbent) | 119,921 | 59.90 | |
| Republican | Robert Wick | 80,266 | 40.09 | |
| No party | Liu (write-in) | 17 | 0.01 | |
| Total votes | 200,204 | 100.0 | ||
| Turnout | ||||
| Democratic hold | ||||
1995 (Special)
| Party | Candidate | Votes | % | |||
|---|---|---|---|---|---|---|
| Republican | Tom Campbell | 54,372 | 58.85 | |||
| Democratic | Jerry Estruth | 33,051 | 35.77 | |||
| Independent | Linh Kieu Dao | 4,922 | 5.33 | |||
| Reform | Connor Vlakancic (write-in) | 42 | 0.05 | |||
| Total votes | 92,387 | 100.00 | ||||
| Turnout | ||||||
| Republican gain from Democratic | ||||||
1996
| Party | Candidate | Votes | % | |
|---|---|---|---|---|
| Republican | Tom Campbell (Incumbent) | 132,737 | 58.6 | |
| Democratic | Dick Lane | 79,048 | 34.9 | |
| Reform | Valli Sharpe-Geisler | 6,230 | 2.7 | |
| Libertarian | Ed Wimmers | 5,481 | 2.4 | |
| Natural Law | Bruce Currivan | 3,372 | 1.4 | |
| Republican | Linh Dao (write-in) | 9 | 0.0 | |
| Republican | Connor Vlakancic (write-in) | 9 | 0.0 | |
| Total votes | 226,886 | 100.0 | ||
| Turnout | ||||
| Republican hold | ||||
1998
| Party | Candidate | Votes | % | |
|---|---|---|---|---|
| Republican | Tom Campbell (Incumbent) | 111,876 | 60.54 | |
| Democratic | Dick Lane | 70,059 | 37.91 | |
| Natural Law | Frank Strutner | 2,843 | 1.54 | |
| Republican | Constant Vlakancic (write-in) | 8 | 0.00 | |
| Total votes | 184,786 | 100.0 | ||
| Turnout | ||||
| Republican hold | ||||
2000
| Party | Candidate | Votes | % | |||
|---|---|---|---|---|---|---|
| Democratic | Mike Honda | 128,545 | 54.3 | |||
| Republican | Jim Cunneen | 99,866 | 42.2 | |||
| Libertarian | Ed Wimmers | 4,820 | 2.0 | |||
| Natural Law | Douglas C. Gorney | 3,591 | 1.5 | |||
| No party | Phillip Kronzer (write-in) | 82 | 0.0 | |||
| Total votes | 236,904 | 100.0 | ||||
| Turnout | ||||||
| Democratic gain from Republican | ||||||
2002
| Party | Candidate | Votes | % | |
|---|---|---|---|---|
| Democratic | Mike Honda (Incumbent) | 87,482 | 65.8 | |
| Republican | Linda Rae Hermann | 41,251 | 31.0 | |
| Libertarian | Jeff Landauer | 4,289 | 3.2 | |
| Total votes | 133,022 | 100.0 | ||
| Turnout | ||||
| Democratic hold | ||||
2004
| Party | Candidate | Votes | % | |
|---|---|---|---|---|
| Democratic | Mike Honda (Incumbent) | 154,385 | 72.1 | |
| Republican | Raymond Chukwu | 59,953 | 27.9 | |
| Total votes | 214,338 | 100.0 | ||
| Turnout | ||||
| Democratic hold | ||||
2006
| Party | Candidate | Votes | % | |
|---|---|---|---|---|
| Democratic | Mike Honda (Incumbent) | 115,532 | 72.4 | |
| Republican | Raymond Chukwu | 44,186 | 27.6 | |
| Total votes | 186,718 | 100.0 | ||
| Turnout | ||||
| Democratic hold | ||||
2008
| Party | Candidate | Votes | % | |
|---|---|---|---|---|
| Democratic | Mike Honda (Incumbent) | 170,977 | 71.66 | |
| Republican | Joyce Stoer Cordi | 55,489 | 23.26 | |
| Green | Peter Myers | 12,123 | 5.08 | |
| Total votes | 238,589 | 100.0 | ||
| Turnout | ||||
| Democratic hold | ||||
2010
| Party | Candidate | Votes | % | |
|---|---|---|---|---|
| Democratic | Mike Honda (Incumbent) | 126,147 | 67.60 | |
| Republican | Scott Kirkland | 60,468 | 32.40 | |
| Total votes | 186,615 | 100.00 | ||
| Turnout | ||||
| Democratic hold | ||||
2012
| Party | Candidate | Votes | % | |
|---|---|---|---|---|
| Democratic | Eric Swalwell | 120,388 | 52.1 | |
| Democratic | Pete Stark (Incumbent) | 110,646 | 47.9 | |
| Total votes | 231,034 | 100.00 | ||
| Democratic hold | ||||
2014
| Party | Candidate | Votes | % | |
|---|---|---|---|---|
| Democratic | Eric Swalwell (Incumbent) | 99,756 | 69.8 | |
| Republican | Hugh Bussell | 43,150 | 30.2 | |
| Total votes | 142,906 | 100.00 | ||
| Democratic hold | ||||
2016
| Party | Candidate | Votes | % | |
|---|---|---|---|---|
| Democratic | Eric Swalwell (Incumbent) | 198,578 | 73.8 | |
| Republican | Danny R. Turner | 70,619 | 26.2 | |
| Total votes | 269,197 | 100 | ||
| Democratic hold | ||||
2018
| Party | Candidate | Votes | % | |
|---|---|---|---|---|
| Democratic | Eric Swalwell (Incumbent) | 177,989 | 73.0 | |
| Republican | Rudy L. Peters Jr. | 65,940 | 27.0 | |
| Total votes | 243,929 | 100 | ||
| Democratic hold | ||||
2020
| Party | Candidate | Votes | % | |
|---|---|---|---|---|
| Democratic | Eric Swalwell (incumbent) | 242,991 | 70.9 | |
| Republican | Alison Hayden | 99,710 | 29.1 | |
| Total votes | 342,701 | 100.0 | ||
| Democratic hold | ||||
References
- Center for New Media & Promotion (CNMP), US Census Bureau. "My Congressional District". www.census.gov.
- "Partisan Voting Index – Districts of the 115th Congress" (PDF). The Cook Political Report. April 7, 2017. Retrieved April 7, 2017.
- "Statement of Vote (2000 President)" (PDF). Archived from the original (PDF) on May 20, 2011.
- "Statement of Vote (2000 Senator)" (PDF). Archived from the original (PDF) on May 20, 2011.
- "Statement of Vote (2002 Governor)" (PDF). Archived from the original (PDF) on November 11, 2010.
- "Statement of Vote (2003 Recall Question)" (PDF). Archived from the original (PDF) on May 20, 2011.
- "Statement of Vote (2003 Governor)" (PDF). Archived from the original (PDF) on May 20, 2011.
- "Statement of Vote (2004 President)" (PDF). Archived from the original (PDF) on May 20, 2011.
- "Statement of Vote (2004 Senator)" (PDF). Archived from the original (PDF) on August 10, 2011.
- "Statement of Vote (2006 Senator)" (PDF). Archived from the original (PDF) on August 10, 2011.
- "Statement of Vote (2006 Governor)" (PDF). Archived from the original (PDF) on August 10, 2011.
- "(2008 President)". Archived from the original on February 11, 2009. Retrieved March 5, 2009.
- "1932 election results" (PDF).
- "1934 election results" (PDF).
- "1936 election results" (PDF).
- "1938 election results" (PDF).
- "1940 election results" (PDF).
- "1942 election results" (PDF).
- "1944 election results" (PDF).
- "1946 election results" (PDF).
- "1948 election results" (PDF).
- "1950 election results" (PDF).
- "1952 election results" (PDF).
- "1954 election results" (PDF).
- "1956 election results" (PDF).
- "1958 election results" (PDF).
- "1960 election results" (PDF).
- "1962 election results" (PDF).
- "1964 election results" (PDF).
- "1966 election results" (PDF).
- "1968 election results" (PDF).
- "1970 election results" (PDF).
- "1972 election results" (PDF).
- "1974 election results" (PDF).
- "1976 election results" (PDF).
- "1978 election results" (PDF).
- "1980 election results" (PDF).
- "1982 election results" (PDF).
- "1984 election results" (PDF).
- "1986 election results" (PDF).
- "1988 election results" (PDF).
- "JoinCalifornia - 09-12-1989 Election". www.joincalifornia.com.
- "1990 election results" (PDF).
- "1992 election results" (PDF).
- "1994 election results" (PDF).
- "JoinCalifornia - 12-12-1995 Election". www.joincalifornia.com.
- "1996 election results" (PDF).
- "1998 election results" (PDF).
- "2000 election results" (PDF).
- "2002 election results" (PDF). Archived from the original (PDF) on February 3, 2009.
- "2004 election results" (PDF).
- "2006 election results" (PDF). Archived from the original (PDF) on November 27, 2008.
- "November 4 Presidential Primary Election - SUMMARY RESULTS". www.sccgov.org.
- "November 2, 2010 Gubernatorial General Election - SUMMARY RESULTS". www.sccgov.org.
- "2012 general election results" (PDF). Archived from the original (PDF) on October 19, 2013.
- "House of Representatives District 15 - Districtwide Results". Archived from the original on December 21, 2014. Retrieved December 21, 2014.
- "Statement of Vote - November 8, 2016, General Election" (PDF). www.sos.ca.gov. California Secretary of State. p. 5. Retrieved January 17, 2019.
- "General Election - Statement of Vote, November 6, 2018 — United States Representative in Congress by District" (PDF). www.sos.ca.gov. California Secretary of State. p. 5. Retrieved January 17, 2019.