Beech Island, South Carolina
Beech Island is an unincorporated community and census-designated place (CDP) in Aiken County, South Carolina, United States.[2] It was first listed as a CDP in the 2020 census with a population of 1,421.[3]
Beech Island, South Carolina | |
|---|---|
 Beech Island | |
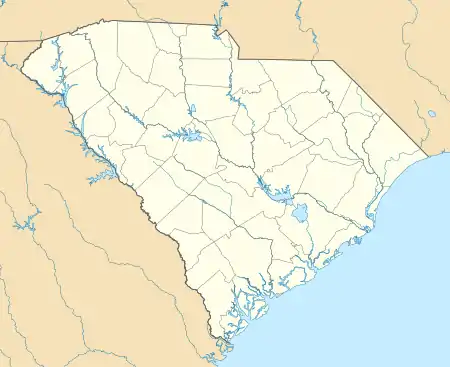
| Coordinates: 33°25′39″N 81°53′27″W | |
| Country | |
| State | |
| County | |
| Population (2020) | |
| • Total | 1,421 |
| Time zone | UTC-5 (Eastern (EST)) |
| • Summer (DST) | UTC-4 (EDT) |
| ZIP code | 29842 |
| Area codes | 803, 839 |
| GNIS feature ID | 1245034[1] |
History
According to tradition, the community was first named "Beech Highland" on account of its lofty elevation, and over time the H was dropped, causing the present name to be adopted.[4]
Beech Island was primarily an agricultural community before the 1950s. Cotton, wheat, corn, and soybean were the major crops. This changed with the construction of Urquhart Station Power Station and the nearby Savannah River Nuclear Project. New highways were built to accommodate the workers commuting to the Nuclear Project. Commerce grew and the community began to change. In the 1960s Kimberly-Clark built a large manufacturing facility on what was once farmland, creating more jobs. The boom, however, was short-lived.
Beech Island's most famous resident was James Brown, who lived there for the last few decades of his life on a 60-acre (240,000 m2) estate. Brown is buried in the Thomas Family Home Crypt on Beech Island.
The Cedars, Fort Moore-Savano Town Site, Redcliffe Plantation State Historic Site, Oakland Plantation, and Zubly Cemetery are listed on the National Register of Historic Places.[5][6]
Beech Island is also home to most of the television transmitters that serve the Augusta, GA MSA.
Demographics
| Historical population | |||
|---|---|---|---|
| Census | Pop. | %± | |
| 2020 | 1,421 | — | |
| U.S. Decennial Census[7] 2020[8] | |||
2020 census
| Race / Ethnicity | Pop 2020[8] | % 2020 |
|---|---|---|
| White alone (NH) | 694 | 48.84% |
| Black or African American alone (NH) | 548 | 38.56% |
| Native American or Alaska Native alone (NH) | 7 | 0.49% |
| Asian alone (NH) | 7 | 0.49% |
| Pacific Islander alone (NH) | 3 | 0.21% |
| Some Other Race alone (NH) | 5 | 0.35% |
| Mixed Race/Multi-Racial (NH) | 81 | 5.70% |
| Hispanic or Latino (any race) | 76 | 5.35% |
| Total | 1,421 | 100.00% |
Note: the US Census treats Hispanic/Latino as an ethnic category. This table excludes Latinos from the racial categories and assigns them to a separate category. Hispanics/Latinos can be of any race.
See also
- Beech Island Historical Society
- U.S. Geological Survey Geographic Names Information System: Beech Island, South Carolina - the island in Georgia
- U.S. Geological Survey Geographic Names Information System: Beech Island, South Carolina - the community in South Carolina
References
- "US Board on Geographic Names". United States Geological Survey. Retrieved 2017-05-06.
- Walter Edgar, Ed.: The South Carolina Encyclopedia, The University of South Carolina Press, Columbia, S.C., 2006, p. 63.
- "Beech Island CDP, South Carolina". United States Census Bureau. Retrieved April 7, 2022.
- Federal Writers' Project (1941). Palmetto Place Names. Sloane Printing Co. p. 24.
- "National Register Information System". National Register of Historic Places. National Park Service. July 9, 2010.
- "National Register of Historic Places Listings". Weekly List of Actions Taken on Properties: 8/15/11 through 8/19/11. National Park Service. 2011-08-26.
- "Decennial Census of Population and Housing by Decades". US Census Bureau.
- "P2 HISPANIC OR LATINO, AND NOT HISPANIC OR LATINO BY RACE – 2020: DEC Redistricting Data (PL 94-171) – Beech Island CDP, South Carolina". United States Census Bureau.
Municipalities and communities of Aiken County, South Carolina, United States | ||
|---|---|---|
| Cities | 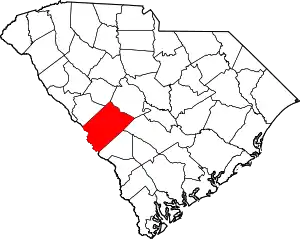 Map of South Carolina highlighting Aiken County | |
| Towns | ||
| CDPs | ||
| Other communities | ||
| Ghost town | ||
| Footnotes | ‡This populated place also has portions in an adjacent county or counties | |
| ||