Alicia, Zamboanga Sibugay
Alicia, officially the Municipality of Alicia (Cebuano: Lungsod sa Alicia; Chavacano: Municipalidad de Alicia; Tagalog: Bayan ng Alicia), is a 3rd class municipality in the province of Zamboanga Sibugay, Philippines. According to the 2020 census, it has a population of 39,456 people. [3]. Alicia is the gateway to Olutanga Island via Guicam Port in Brgy. Guicam where the Guicam Bridge will soon rise.
Alicia | |
|---|---|
| Municipality of Alicia | |
 Seal | |
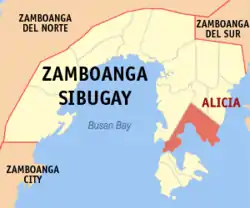 Map of Zamboanga Sibugay with Alicia highlighted | |
OpenStreetMap 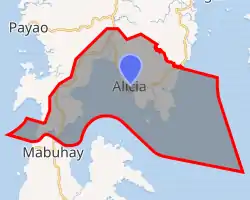 | |
.svg.png.webp) Alicia Location within the Philippines | |
| Coordinates: 7°30′22″N 122°56′28″E | |
| Country | Philippines |
| Region | Zamboanga Peninsula |
| Province | Zamboanga Sibugay |
| District | 1st district |
| Barangays | 27 (see Barangays) |
| Government | |
| • Type | Sangguniang Bayan |
| • Mayor | Remberto G. Sotto |
| • Vice Mayor | Filna Rhina A. Tan |
| • Representative | Wilter W. Palma II |
| • Municipal Council | Members |
| • Electorate | 26,101 voters (2019) |
| Area | |
| • Total | 183.08 km2 (70.69 sq mi) |
| Elevation | 22 m (72 ft) |
| Highest elevation | 271 m (889 ft) |
| Lowest elevation | −4 m (−13 ft) |
| Population | |
| • Total | 39,456 |
| • Density | 220/km2 (560/sq mi) |
| • Households | 7,630 |
| Economy | |
| • Income class | 3rd municipal income class |
| • Poverty incidence | 37.31% (2018)[4] |
| • Revenue | ₱154,993,000.00 (2020) |
| • Assets | ₱591,608,000.00 (2020) |
| • Expenditure | ₱135,574,000.00 (2020) |
| • Liabilities | ₱287,112,000.00 (2020) |
| Service provider | |
| • Electricity | Zamboanga del Sur 2 Electric Cooperative (ZAMSURECO 2) |
| Time zone | UTC+8 (PST) |
| ZIP code | 7040 |
| PSGC | |
| IDD : area code | +63 (0)62 |
| Native languages | Subanon Cebuano Chavacano Tagalog |
| Website | www |
Geography
Barangays
Alicia is politically subdivided into 27 barangays.
- Alegria
- Bagong Buhay
- Bella
- Calades
- Concepcion
- Dawa-dawa
- Gulayon
- Ilisan
- Kapatagan
- Kauswagan
- Kawayan
- La Paz
- Lambuyogan
- Lapirawan
- Litayon
- Lutiman
- Milagrosa (Baluno)
- Naga-naga
- Pandan-pandan
- Payongan
- Poblacion
- Santa Maria
- Santo Niño
- Talaptap
- Tampalan
- Tandiong Muslim
- Timbang-timbang
Climate
| Climate data for Alicia, Zamboanga Sibugay | |||||||||||||
|---|---|---|---|---|---|---|---|---|---|---|---|---|---|
| Month | Jan | Feb | Mar | Apr | May | Jun | Jul | Aug | Sep | Oct | Nov | Dec | Year |
| Average high °C (°F) | 31 (88) |
31 (88) |
31 (88) |
31 (88) |
30 (86) |
29 (84) |
29 (84) |
29 (84) |
29 (84) |
29 (84) |
30 (86) |
30 (86) |
30 (86) |
| Average low °C (°F) | 23 (73) |
23 (73) |
24 (75) |
24 (75) |
25 (77) |
25 (77) |
24 (75) |
24 (75) |
24 (75) |
24 (75) |
24 (75) |
23 (73) |
24 (75) |
| Average precipitation mm (inches) | 61 (2.4) |
55 (2.2) |
75 (3.0) |
81 (3.2) |
145 (5.7) |
189 (7.4) |
189 (7.4) |
197 (7.8) |
162 (6.4) |
181 (7.1) |
115 (4.5) |
70 (2.8) |
1,520 (59.9) |
| Average rainy days | 16.4 | 15.7 | 19.1 | 21.5 | 26.9 | 27.1 | 26.4 | 25.0 | 24.2 | 26.8 | 23.5 | 18.7 | 271.3 |
| Source: Meteoblue [5] (Use with caution: this is modeled/calculated data, not measured locally.) | |||||||||||||
Demographics
| Year | Pop. | ±% p.a. |
|---|---|---|
| 1960 | 13,277 | — |
| 1970 | 19,272 | +3.79% |
| 1975 | 14,173 | −5.98% |
| 1980 | 20,591 | +7.75% |
| 1990 | 24,803 | +1.88% |
| 1995 | 27,959 | +2.27% |
| 2000 | 29,954 | +1.49% |
| 2007 | 32,289 | +1.04% |
| 2010 | 34,895 | +2.86% |
| 2015 | 36,013 | +0.60% |
| 2020 | 39,456 | +1.81% |
| Source: Philippine Statistics Authority [6] [7] [8][9] | ||
Economy
| Poverty Incidence of Alicia | |
| Source: Philippine Statistics Authority[10][11][12][13][14][15][16] | |
References
- Municipality of Alicia | (DILG)
- "2015 Census of Population, Report No. 3 – Population, Land Area, and Population Density" (PDF). Philippine Statistics Authority. Quezon City, Philippines. August 2016. ISSN 0117-1453. Archived (PDF) from the original on May 25, 2021. Retrieved July 16, 2021.
- Census of Population (2020). "Region IX (Zamboanga Peninsula)". Total Population by Province, City, Municipality and Barangay. PSA. Retrieved 8 July 2021.
- "PSA Releases the 2018 Municipal and City Level Poverty Estimates". Philippine Statistics Authority. 15 December 2021. Retrieved 22 January 2022.
- "Alicia: Average Temperatures and Rainfall". Meteoblue. Retrieved 1 May 2020.
- Census of Population (2015). "Region IX (Zamboanga Peninsula)". Total Population by Province, City, Municipality and Barangay. PSA. Retrieved 20 June 2016.
- Census of Population and Housing (2010). "Region IX (Zamboanga Peninsula)". Total Population by Province, City, Municipality and Barangay. NSO. Retrieved 29 June 2016.
- Censuses of Population (1903–2007). "Region IX (Zamboanga Peninsula)". Table 1. Population Enumerated in Various Censuses by Province/Highly Urbanized City: 1903 to 2007. NSO.
- "Province of Zamboanga Sibugay". Municipality Population Data. Local Water Utilities Administration Research Division. Retrieved 17 December 2016.
- "Poverty incidence (PI):". Philippine Statistics Authority. Retrieved 28 December 2020.
- https://psa.gov.ph/sites/default/files/NSCB_LocalPovertyPhilippines_0.pdf; publication date: 29 November 2005; publisher: Philippine Statistics Authority.
- https://psa.gov.ph/sites/default/files/2003%20SAE%20of%20poverty%20%28Full%20Report%29_1.pdf; publication date: 23 March 2009; publisher: Philippine Statistics Authority.
- https://psa.gov.ph/sites/default/files/2006%20and%202009%20City%20and%20Municipal%20Level%20Poverty%20Estimates_0_1.pdf; publication date: 3 August 2012; publisher: Philippine Statistics Authority.
- https://psa.gov.ph/sites/default/files/2012%20Municipal%20and%20City%20Level%20Poverty%20Estima7tes%20Publication%20%281%29.pdf; publication date: 31 May 2016; publisher: Philippine Statistics Authority.
- https://psa.gov.ph/sites/default/files/City%20and%20Municipal-level%20Small%20Area%20Poverty%20Estimates_%202009%2C%202012%20and%202015_0.xlsx; publication date: 10 July 2019; publisher: Philippine Statistics Authority.
- "PSA Releases the 2018 Municipal and City Level Poverty Estimates". Philippine Statistics Authority. 15 December 2021. Retrieved 22 January 2022.
External links
- Alicia Profile at PhilAtlas.com
- Philippine Standard Geographic Code
- Philippine Census Information
- Alicia Official Website
Places adjacent to Alicia, Zamboanga Sibugay | ||||||||||||||||
|---|---|---|---|---|---|---|---|---|---|---|---|---|---|---|---|---|
| ||||||||||||||||
Ipil (capital) | |
| Municipalities | |
This article is issued from Wikipedia. The text is licensed under Creative Commons - Attribution - Sharealike. Additional terms may apply for the media files.