2021 North Hertfordshire District Council election
The 2021 North Hertfordshire District Council election took place on 6 May 2021 to elect 17 of the 49 members of North Hertfordshire District Council in England.[1] This was on the same day as other local elections around the country.
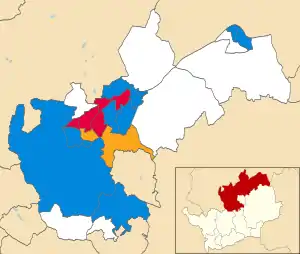
Map showing the results of the 2021 North Hertfordshire District Council election
Results summary
| 2021 North Hertfordshire District Council election | ||||||||||
|---|---|---|---|---|---|---|---|---|---|---|
| Party | This election | Full council | This election | |||||||
| Seats | Net | Seats % | Other | Total | Total % | Votes | Votes % | +/− | ||
| Conservative | 10 | 58.8 | 13 | 23 | 46.9 | 14,518 | 41.5 | +5.8 | ||
| Labour | 5 | 29.4 | 10 | 15 | 30.6 | 9,402 | 26.9 | +5.3 | ||
| Liberal Democrats | 2 | 11.8 | 9 | 11 | 22.4 | 6,978 | 20.0 | -8.1 | ||
| Green | 0 | 0.0 | 0 | 0 | 0.0 | 3,730 | 10.7 | +0.2 | ||
| Independent | 0 | 0.0 | 0 | 0 | 0.0 | 167 | 0.5 | New | ||
| Reform UK | 0 | 0.0 | 0 | 0 | 0.0 | 59 | 0.2 | New | ||
| CPA | 0 | 0.0 | 0 | 0 | 0.0 | 53 | 0.2 | New | ||
| SDP | 0 | 0.0 | 0 | 0 | 0.0 | 39 | 0.1 | New | ||
Ward results
Baldock East
| Party | Candidate | Votes | % | ±% | |
|---|---|---|---|---|---|
| Conservative | Juan Cowell | 495 | 43.3 | -2.8 | |
| Liberal Democrats | Richard Winter | 302 | 26.4 | -0.2 | |
| Labour | Leo Chapman | 212 | 18.6 | +6.7 | |
| Green | Jane Turner | 133 | 11.6 | +6.9 | |
| Majority | 193 | 16.9 | |||
| Turnout | 1,154 | 49.4 | |||
| Conservative hold | Swing | ||||
Changes from the 2016 election.
Baldock Town
| Party | Candidate | Votes | % | ±% | |
|---|---|---|---|---|---|
| Conservative | Michael Weeks | 1,120 | 48.3 | -3.1 | |
| Labour | Alistair Willoughby | 734 | 31.7 | +14.2 | |
| Liberal Democrats | Steve Thomas | 242 | 10.4 | -8.7 | |
| Green | Tim Lee | 223 | 9.6 | -1.4 | |
| Majority | 386 | 16.6 | |||
| Turnout | 2,335 | 40.6 | +8.6 | ||
| Conservative hold | Swing | ||||
Chesfield
| Party | Candidate | Votes | % | ±% | |
|---|---|---|---|---|---|
| Liberal Democrats | Terry Tyler | 728 | 42.7 | +18.9 | |
| Conservative | Dominic Griffiths | 727 | 42.6 | +0.6 | |
| Labour | Tom Hogan | 251 | 14.7 | -1.3 | |
| Majority | 1 | 0.1 | |||
| Turnout | 1,721 | 32.6 | +5.1 | ||
| Liberal Democrats hold | Swing | ||||
The result was a Tie, broken by Tyler (LD) and Griffiths (Con) drawing straws.
Hitchin Bearton
| Party | Candidate | Votes | % | ±% | |
|---|---|---|---|---|---|
| Labour | Ian Albert | 1,314 | 49.4 | -4.3 | |
| Conservative | Ralph Muncer | 586 | 22.0 | +6.8 | |
| Green | Ann Sander | 383 | 14.4 | +0.7 | |
| Liberal Democrats | Jonathan Clayden | 378 | 14.2 | -2.1 | |
| Majority | 728 | 27.4 | |||
| Turnout | 2,681 | 41.6 | +7.1 | ||
| Labour hold | Swing | ||||
Hitchin Highbury
| Party | Candidate | Votes | % | ±% | |
|---|---|---|---|---|---|
| Liberal Democrats | Paul Clark | 1,416 | 48.4 | -13.8 | |
| Conservative | Gulshan Mangat | 820 | 28.1 | +7.4 | |
| Labour | Angela Griggs | 412 | 14.1 | +4.6 | |
| Green | Deolinda Eltringham | 242 | 8.3 | +1.3 | |
| CPA | Leigh Smith | 33 | 1.1 | New | |
| Majority | 596 | 20.3 | |||
| Turnout | 2,941 | 46.9 | +5.0 | ||
| Liberal Democrats hold | Swing | ||||
Hitchin Oughton
| Party | Candidate | Votes | % | ±% | |
|---|---|---|---|---|---|
| Labour | Nigel Mason | 501 | 39.1 | -15.3 | |
| Conservative | Steven Patmore | 369 | 28.8 | +0.1 | |
| Green | Mary Marshall | 245 | 19.1 | +11.5 | |
| Liberal Democrats | Thomas Grunshaw | 101 | 7.9 | -1.3 | |
| Independent | Jacqueline McDonald | 65 | 5.1 | New | |
| Majority | 132 | 10.3 | |||
| Turnout | 1,298 | 35.0 | |||
| Labour hold | Swing | ||||
Changes from the 2018 election.
Hitchin Priory
| Party | Candidate | Votes | % | ±% | |
|---|---|---|---|---|---|
| Conservative | Richard Thake | 787 | 42.0 | +0.8 | |
| Liberal Democrats | Raj Bhakar | 548 | 29.2 | -2.7 | |
| Labour | Peter Taylor | 286 | 15.3 | -3.9 | |
| Green | Des Stephens | 233 | 12.4 | -5.3 | |
| CPA | Sid Cordle | 20 | 1.1 | New | |
| Majority | 239 | 12.8 | |||
| Turnout | 1,885 | 49.5 | |||
| Conservative hold | Swing | ||||
Changes from the 2018 election.
Hitchin Walsworth
| Party | Candidate | Votes | % | ±% | |
|---|---|---|---|---|---|
| Labour | Elizabeth Dennis-Harburg | 1,154 | 41.4 | -3.0 | |
| Conservative | Charles Laing | 1,042 | 37.3 | +11.8 | |
| Liberal Democrats | Liz Townsend | 301 | 10.8 | -0.6 | |
| Green | Sam Larsen | 293 | 10.5 | -7.0 | |
| Majority | 112 | 4.1 | |||
| Turnout | 2,802 | 44.5 | +7.4 | ||
| Labour hold | Swing | ||||
Hitchwood, Offa and Hoo
| Party | Candidate | Votes | % | ±% | |
|---|---|---|---|---|---|
| Conservative | Claire Strong | 1,436 | 52.4 | -2.3 | |
| Green | Adina Claire | 787 | 28.7 | +11.6 | |
| Labour | Anton Jungreuthmayer | 304 | 11.1 | -1.3 | |
| Liberal Democrats | Philippa Wright | 214 | 7.8 | -6.7 | |
| Majority | 649 | 23.7 | |||
| Turnout | 2,751 | 46.5 | |||
| Conservative hold | Swing | ||||
Knebworth
| Party | Candidate | Votes | % | ±% | |
|---|---|---|---|---|---|
| Conservative | Amanda Tandi | 1,235 | 57.5 | +17.8 | |
| Liberal Democrats | Susana Munoz Maniega | 629 | 29.3 | -21.9 | |
| Labour | Doug Jenner | 185 | 8.6 | +1.1 | |
| Green | Davina Malcolm | 97 | 4.5 | +2.9 | |
| Majority | 606 | 28.2 | |||
| Turnout | 2,187 | 52.1 | |||
| Conservative hold | Swing | ||||
Changes from the 2018 election.
Letchworth East
| Party | Candidate | Votes | % | ±% | |
|---|---|---|---|---|---|
| Labour | Ian Mantle | 711 | 44.4 | -7.3 | |
| Conservative | James Durston | 467 | 29.2 | +4.2 | |
| Green | David Morris | 205 | 12.8 | +8.0 | |
| Liberal Democrats | Mark Spencer | 115 | 7.2 | -0.5 | |
| Independent | Paul Ross | 102 | 6.4 | -4.4 | |
| Majority | 244 | 15.2 | |||
| Turnout | 1,608 | 35.9 | |||
| Labour hold | Swing | ||||
Changes from the 2018 election.
Letchworth Grange
| Party | Candidate | Votes | % | ±% | |
|---|---|---|---|---|---|
| Conservative | Simon Bloxham | 1,059 | 48.0 | +10.1 | |
| Labour | Sean Nolan | 733 | 33.2 | +3.1 | |
| Green | Elizabeth Hancock | 215 | 9.7 | +0.5 | |
| Liberal Democrats | Amy Finch | 200 | 9.1 | -0.9 | |
| Majority | 326 | 14.8 | |||
| Turnout | 2,222 | 39.4 | |||
| Conservative gain from Labour | Swing | ||||
Letchworth South East
| Party | Candidate | Votes | % | ±% | |
|---|---|---|---|---|---|
| Conservative | David Levett | 966 | 46.4 | +3.8 | |
| Labour | Martin Stears-Handscomb | 726 | 34.9 | -8.4 | |
| Liberal Democrats | Paul Marment | 175 | 8.4 | New | |
| Green | Hazel Middleton | 155 | 7.4 | New | |
| Reform UK | Garry Warren | 59 | 2.8 | New | |
| Majority | 240 | 11.5 | |||
| Turnout | 2,094 | 39.0 | |||
| Conservative hold | Swing | ||||
Letchworth South West
| Party | Candidate | Votes | % | ±% | |
|---|---|---|---|---|---|
| Conservative | Terry Hone | 1,276 | 46.3 | +11.7 | |
| Liberal Democrats | Phil Weeder | 724 | 26.3 | -8.3 | |
| Labour | Tom Plater | 474 | 17.2 | +5.1 | |
| Green | Alan Borgars | 245 | 8.9 | +0.2 | |
| SDP | Michael McGetrick | 39 | 1.4 | New | |
| Majority | 552 | 20.0 | |||
| Turnout | 2,787 | 46.0 | |||
| Conservative hold | Swing | ||||
Letchworth Wilbury
| Party | Candidate | Votes | % | ±% | |
|---|---|---|---|---|---|
| Labour | Amy Allen | 771 | 54.0 | -4.3 | |
| Conservative | Monica Bloxham | 536 | 37.5 | +10.7 | |
| Liberal Democrats | Sal Jarvis | 121 | 8.5 | +3.4 | |
| Majority | 235 | 16.5 | |||
| Turnout | 1,452 | 36.1 | |||
| Labour hold | Swing | ||||
Changes from the 2018 election.
Royston Meridian
| Party | Candidate | Votes | % | ±% | |
|---|---|---|---|---|---|
| Conservative | Adam Compton | 889 | 49.4 | +2.1 | |
| Liberal Democrats | Alex Prosser-Snelling | 579 | 32.2 | +9.2 | |
| Labour | John Rees | 176 | 9.8 | -0.1 | |
| Green | Hugh Parker | 154 | 8.6 | -0.9 | |
| Majority | 310 | 17.2 | |||
| Turnout | 1,816 | 42.8 | |||
| Conservative hold | Swing | ||||
Royston Palace
| Party | Candidate | Votes | % | ±% | |
|---|---|---|---|---|---|
| Conservative | Sarah Dingley | 708 | 47.5 | +9.7 | |
| Labour | Cathy Brownjohn | 458 | 30.7 | -2.4 | |
| Liberal Democrats | Hugo Rainey | 205 | 13.7 | -0.7 | |
| Green | Steven Turner | 120 | 8.0 | -5.6 | |
| Majority | 250 | 16.8 | |||
| Turnout | 1,507 | 34.3 | |||
| Conservative hold | Swing | ||||
By-elections
Hitchin Highbury
| Party | Candidate | Votes | % | ±% | |
|---|---|---|---|---|---|
| Liberal Democrats | Raj Bhakar | 1,238 | 67.0 | +18.5 | |
| Conservative | Samuel Forsyth | 450 | 24.3 | -3.7 | |
| Green | Deolinda Eltringham | 134 | 7.2 | -1.0 | |
| CPA | Leigh Smith | 27 | 1.5 | +0.3 | |
| Majority | 788 | 42.7 | |||
| Turnout | 1,861 | 30.0 | |||
| Liberal Democrats hold | Swing | ||||
References
- "May 2021 Elections | North Hertfordshire District Council". www.north-herts.gov.uk.
This article is issued from Wikipedia. The text is licensed under Creative Commons - Attribution - Sharealike. Additional terms may apply for the media files.