2020 United States presidential election in Michigan
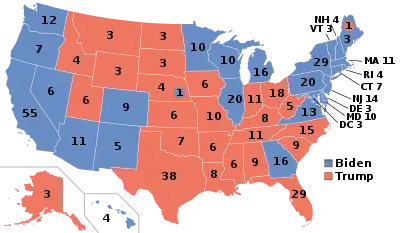
The 2020 United States presidential election in Michigan was held on Tuesday, November 3, 2020, as part of the 2020 United States presidential election in which all 50 states plus the District of Columbia participated.[2] Michigan voters chose electors to represent them in the Electoral College via a popular vote, pitting the Republican Party's nominee, incumbent President Donald Trump of Florida, and his running mate, Vice President Mike Pence of Indiana against Democratic Party nominee, former Vice President Joe Biden of Delaware, and his running mate, Senator Kamala Harris of California. Michigan has 16 electoral votes in the Electoral College.[3]
| ||||||||||||||||||||||||||
| Turnout | 71% | |||||||||||||||||||||||||
|---|---|---|---|---|---|---|---|---|---|---|---|---|---|---|---|---|---|---|---|---|---|---|---|---|---|---|
| ||||||||||||||||||||||||||
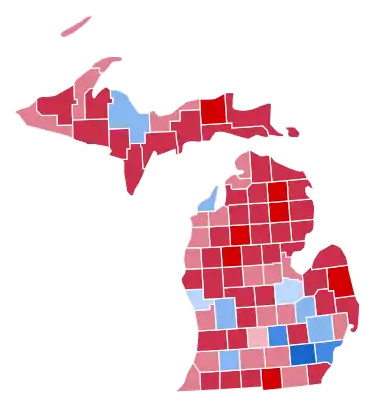 County results
| ||||||||||||||||||||||||||
| ||||||||||||||||||||||||||
.jpg.webp)
.jpg.webp)
| Elections in Michigan |
|---|
 |
In 2016, Trump became the first Republican to carry Michigan since 1988, when George H. W. Bush scored a decisive nationwide win against Michael Dukakis.[4] Throughout the campaign, Biden touted his work on the auto bailout in manufacturing towns outside Detroit. Appearing with United Auto Workers, Biden presented a new proposal to penalize American companies for moving manufacturing and service jobs overseas and then selling their products back in the United States.[5] Polls of Michigan throughout the campaign generally indicated a clear Biden lead. Prior to election day, most news organizations considered Michigan a likely blue state, or a state that Biden was likely to win.
Biden ultimately carried Michigan by a 2.78% margin. Per exit polls by the Associated Press, Biden's strength in Michigan came from union households, who composed 21% of the electorate and supported Biden by 56%–42%. Biden was also able to boost minority turnout, consequently winning 93% of Black American voters.[6] Many voters were also concerned with the COVID-19 pandemic, which had hit the state hard; 52% of voters felt the pandemic was not under control at all, and these voters broke for Biden by 82%–16%. Trump outperformed his polling average in the state, but it was not enough to win.
Biden flipped the counties of Leelanau, Kent, and Saginaw and became the first Democrat since Woodrow Wilson in 1916 to win the presidency without winning Bay or Gogebic Counties, the first Democrat since Harry S. Truman in 1948 to win without Monroe County, the first Democrat since John F. Kennedy in 1960 to win without Lake County, the first Democrat since Jimmy Carter in 1976 to win without Calhoun, Isabella, Manistee, Shiawassee, or Van Buren Counties, and the first Democrat since Bill Clinton in 1992 and 1996 to win without winning Macomb or Eaton Counties, respectively.
With Ohio, Florida, and Iowa backing the losing candidate for the first time since 1960, 1992, and 2000 respectively, this election established Michigan, Wisconsin, and Pennsylvania as the states with the longest bellwether streak still in effect today. The last time any of them voted against the winning candidate was 2004, when all three voted for losing Democrat John Kerry.
Primary elections
The primary elections were on March 10, 2020.
Republican primary
Incumbent United States President Donald Trump was challenged by three candidates: former governor Mark Sanford of South Carolina, former congressman Joe Walsh of Illinois, and former governor Bill Weld of Massachusetts. Sanford and Walsh both withdrew prior to the primary. Michigan is the only primary state where Sanford's name remained on the ballot.[7]
| Candidate | Votes | % | Estimated delegates |
|---|---|---|---|
| Donald Trump | 640,552 | 93.7% | 73 |
| Uncommitted | 32,743 | 4.8% | |
| Bill Weld | 6,099 | 0.9% | |
| Mark Sanford (withdrawn) | 4,258 | 0.6% | |
| Joe Walsh (withdrawn) | 4,067 | 0.6% | |
| Total | 683,431 | 100% | 73 |
Democratic primary
Bernie Sanders and former Vice President Joe Biden were the two major declared Democratic candidates.[9]
| Candidate | Votes | % | Delegates |
|---|---|---|---|
| Joe Biden | 840,360 | 52.93 | 73 |
| Bernie Sanders | 576,926 | 36.34 | 52 |
| Michael Bloomberg (withdrawn)[lower-alpha 1] | 73,464 | 4.63 | |
| Elizabeth Warren (withdrawn)[lower-alpha 1] | 26,148 | 1.65 | |
| Pete Buttigieg (withdrawn)[lower-alpha 2] | 22,462 | 1.41 | |
| Amy Klobuchar (withdrawn)[lower-alpha 2] | 11,018 | 0.69 | |
| Tulsi Gabbard | 9,461 | 0.60 | |
| Andrew Yang (withdrawn)[lower-alpha 3] | 2,380 | 0.15 | |
| Tom Steyer (withdrawn)[lower-alpha 2] | 1,732 | 0.11 | |
| Michael Bennet (withdrawn)[lower-alpha 3] | 1,536 | 0.10 | |
| Cory Booker (withdrawn) | 840 | 0.05 | |
| Joe Sestak (withdrawn) | 757 | 0.05 | |
| Marianne Williamson (withdrawn) | 719 | 0.05 | |
| John Delaney (withdrawn)[lower-alpha 4] | 464 | 0.03 | |
| Julian Castro (withdrawn) | 306 | 0.02 | |
| Uncommitted | 19,106 | 1.20 | |
| Total | 1,587,679 | 100% | 125 |
General election
Final predictions
| Source | Ranking |
|---|---|
| The Cook Political Report[11] | Lean D (flip) |
| Inside Elections[12] | Lean D (flip) |
| Sabato's Crystal Ball[13] | Lean D (flip) |
| Politico[14] | Lean D (flip) |
| RCP[15] | Tossup |
| Niskanen[16] | Likely D (flip) |
| CNN[17] | Lean D (flip) |
| The Economist[18] | Likely D (flip) |
| CBS News[19] | Lean D (flip) |
| 270towin[20] | Lean D (flip) |
| ABC News[21] | Lean D (flip) |
| NPR[22] | Lean D (flip) |
| NBC News[23] | Lean D (flip) |
| 538[24] | Solid D (flip) |
Graphical summary
Aggregate polls
| Source of poll aggregation |
Dates administered |
Dates updated |
Joe Biden Democratic |
Donald Trump Republican |
Other/ Undecided [lower-alpha 5] |
Margin |
|---|---|---|---|---|---|---|
| 270 to Win | October 22 – November 2, 2020 | November 3, 2020 | 49.9% | 44.4% | 5.7% | Biden +5.5 |
| Real Clear Politics | October 29 – November 1, 2020 | November 3, 2020 | 50.0% | 45.8% | 4.2% | Biden +4.2 |
| FiveThirtyEight | until November 1, 2020 | November 3, 2020 | 51.2% | 43.2% | 5.6% | Biden +7.9 |
| Average | 50.4% | 44.5% | 5.1% | Biden +5.9 | ||
2020 polls
| Poll source | Date(s) administered |
Sample size[lower-alpha 6] |
Margin of error |
Donald Trump Republican |
Joe Biden Democratic |
Jo Jorgensen Libertarian |
Howie Hawkins Green |
Other | Undecided |
|---|---|---|---|---|---|---|---|---|---|
| SurveyMonkey/Axios | Oct 20 – Nov 2 | 4,549 (LV) | ± 2% | 46%[lower-alpha 7] | 52% | - | - | – | – |
| Research Co. | Oct 31 – Nov 1 | 450 (LV) | ± 4.6% | 43% | 50% | - | - | 2%[lower-alpha 8] | 5% |
| Change Research/CNBC | Oct 29 – Nov 1 | 383 (LV) | ± 5.01% | 44% | 51% | 3% | 1% | – | 1% |
| Swayable Archived November 13, 2020, at the Wayback Machine | Oct 27 – Nov 1 | 413 (LV) | ± 6.5% | 45% | 54% | 1% | 0% | – | – |
| Ipsos/Reuters | Oct 27 – Nov 1 | 654 (LV) | ± 4.4% | 43%[lower-alpha 9] | 53% | 1% | 0% | 2%[lower-alpha 10] | – |
| 42%[lower-alpha 11] | 52% | - | - | 3%[lower-alpha 12] | 3% | ||||
| 45%[lower-alpha 13] | 53% | - | - | 2%[lower-alpha 14] | – | ||||
| Trafalgar Group | Oct 30–31 | 1,033 (LV) | ± 2.97% | 48% | 46% | 2% | - | 1% | 3% |
| AtlasIntel | Oct 30–31 | 686 (LV) | ± 4% | 46% | 48% | - | - | 6% | – |
| Insider Advantage/Center for American Greatness[upper-alpha 1] | Oct 30–31 | 500 (LV) | ± 4.4% | 47% | 49% | 2% | - | – | 3% |
| Morning Consult | Oct 22–31 | 1,736 (LV) | ± 2.0% | 44.5% | 52% | - | - | – | – |
| Emerson College | Oct 29–30 | 700 (LV) | ± 3.4% | 45%[lower-alpha 15] | 52% | - | - | 3%[lower-alpha 16] | – |
| Public Policy Polling/Progress Michigan[upper-alpha 2] | Oct 29–30 | 745 (V) | ± 3.6% | 44% | 54% | 1% | 0% | – | 1% |
| Targoz Market Research/PollSmart | Oct 25–30 | 993 (LV) | – | 39% | 53% | - | - | 8%[lower-alpha 17] | – |
| CNN/SSRS | Oct 23–30 | 907 (LV) | ± 3.8% | 41% | 53% | 2% | 1% | 1%[lower-alpha 18] | 2% |
| Mitchell Research (R)/MIRS | Oct 29 | 817 (LV) | ± 3.43% | 45% | 52% | 1% | 1% | 0%[lower-alpha 19] | 0% |
| RMG Research/PoliticalIQ | Oct 27–29 | 800 (LV) | ± 3.5% | 44%[lower-alpha 9] | 51% | - | - | 3% | 2% |
| 42%[lower-alpha 20] | 53% | - | - | 3% | 2% | ||||
| 45%[lower-alpha 21] | 50% | - | - | 3% | 2% | ||||
| Redfield & Wilton Strategies | Oct 26–29 | 1,212 (LV) | – | 41% | 54% | 1% | 0% | 1% | 4% |
| EPIC-MRA | Oct 25–28 | 600 (LV) | ± 4% | 41% | 48% | - | - | 5%[lower-alpha 22] | 6%[lower-alpha 23] |
| Trafalgar Group | Oct 25–28 | 1,058 (LV) | ± 2.93% | 49% | 47% | 2% | - | 1%[lower-alpha 24] | 1% |
| Kiaer Research | Oct 21–28 | 669 (LV) | ± 5.6% | 41% | 54% | - | - | 2%[lower-alpha 25] | 4% |
| SurveyMonkey/Axios | Oct 1–28, 2020 | 7,541 (LV) | – | 45% | 53% | - | - | – | – |
| Mitchell Research (R)/MIRS | Oct 25–27 | 759 (LV) | ± 3.56% | 42% | 52% | 3% | 0% | 0%[lower-alpha 26] | 2% |
| Swayable | Oct 23–26, 2020 | 394 (LV) | ± 6.7% | 40% | 59% | 2% | 0% | – | – |
| Siena College/NYT Upshot | Oct 23–26 | 856 (LV) | ± 3.8% | 41% | 49% | 2% | 1% | 0%[lower-alpha 27] | 6%[lower-alpha 23] |
| Ipsos/Reuters | Oct 20–26 | 652 (LV) | ± 4.4% | 43%[lower-alpha 9] | 53% | 1% | 0% | 2%[lower-alpha 10] | – |
| 43%[lower-alpha 11] | 52% | - | - | 3%[lower-alpha 12] | 3% | ||||
| Wick Surveys | Oct 24–25 | 1,000 (LV) | ± 3.1% | 48% | 48% | - | - | – | – |
| Glengariff Group/Detroit News | Oct 23–25 | 600 (LV) | ± 4% | 42% | 49% | - | - | 2%[lower-alpha 28] | 4% |
| ABC/Washington Post | Oct 20–25 | 789 (LV) | ± 4% | 44% | 51% | 3% | 0% | 0%[lower-alpha 29] | 1% |
| Gravis Marketing | Oct 24 | 679 (LV) | ± 3.8% | 42% | 55% | - | - | – | 3% |
| Public Policy Polling/American Bridge PAC[upper-alpha 3] | Oct 21–22 | 804 (V) | – | 43% | 50% | - | - | – | 6% |
| YouGov/University of Wisconsin-Madison | Oct 13–21 | 681 (LV) | ± 4.2% | 42% | 52% | - | - | 5%[lower-alpha 30] | – |
| Citizen Data | Oct 17–20 | 1,000 (LV) | ± 3.1% | 41% | 50% | 1% | 0% | 1% | 7% |
| Fox News | Oct 17–20 | 1,032 (LV) | ± 3.0% | 40% | 52% | 3% | 0% | 2%[lower-alpha 31] | 3% |
| Ipsos/Reuters | Oct 14–20 | 686 (LV) | ± 4.3% | 44%[lower-alpha 9] | 52% | 2% | 0% | 2%[lower-alpha 10] | – |
| 44%[lower-alpha 11] | 51% | - | - | 3%[lower-alpha 12] | 2% | ||||
| Morning Consult | Oct 11–20 | 1,717 (LV) | ± 2.4% | 44% | 52% | - | - | – | – |
| Change Research/CNBC | Oct 16–19 | 718 (LV)[lower-alpha 32] | – | 44% | 51% | - | - | – | – |
| EPIC-MRA | Oct 15–19 | 600 (LV) | ± 4% | 39% | 48% | - | - | 5%[lower-alpha 33] | 8%[lower-alpha 23] |
| Mitchell Research (R)/MIRS | Oct 18 | 900 (LV) | ± 3.27% | 41% | 51% | 3% | 1% | 1%[lower-alpha 24] | 3% |
| Trafalgar Group/Restoration PAC[upper-alpha 4] | Oct 15–18 | 1,034 (LV) | ± 2.97% | 47% | 45% | 3% | 2% | 2%[lower-alpha 8] | 2% |
| Data For Progress | Oct 15–18 | 830 (LV) | ± 3.4% | 45% | 50% | 2% | 0% | – | 3% |
| Zia Poll/Painter Communications/MIRS News | Oct 11–18 | 2,851 (LV) | ± 2.5% | 49% | 45% | - | - | 2% | 3% |
| HarrisX/The Hill | Oct 12–15 | 1,289 (LV) | – | 43% | 54% | - | - | – | – |
| Trafalgar Group | Oct 11–14 | 1,025 (LV) | ± 2.97% | 47% | 46% | 3% | 2% | 2%[lower-alpha 8] | 2% |
| Redfield & Wilton Strategies | Oct 10–13 | 972 (LV) | – | 42%[lower-alpha 32] | 51% | 1% | 0% | – | – |
| RMG Research/PoliticalIQ | Oct 8–13 | 800 (LV) | – | 42%[lower-alpha 9] | 48% | 2% | 1% | 1% | 5% |
| 39%[lower-alpha 20] | 51% | 2% | 1% | 1% | 5% | ||||
| 44%[lower-alpha 21] | 46% | 2% | 1% | 1% | 5% | ||||
| Ipsos/Reuters | Oct 7–13 | 620 (LV) | ± 4.5% | 44%[lower-alpha 9] | 51% | 2% | 1% | 2%[lower-alpha 34] | – |
| 43%[lower-alpha 11] | 51% | - | - | 3%[lower-alpha 12] | 2% | ||||
| EPIC-MRA/Detroit Free Press | Oct 8–12 | 600 (LV) | ± 4% | 39% | 48% | - | - | 4%[lower-alpha 35] | 9%[lower-alpha 23] |
| Civiqs/Rust Belt Rising[upper-alpha 5] | Oct 8–11 | 543 (LV) | ± 4.6% | 43% | 52% | - | - | 4%[lower-alpha 36] | 2% |
| Siena College/NYT Upshot | Oct 6–11 | 614 (LV) | ± 4.6% | 40% | 48% | 1% | 1% | 1%[lower-alpha 37] | 8%[lower-alpha 23] |
| Morning Consult | Oct 2–11 | 1,710 (LV) | ± 2.4% | 44% | 51% | - | - | – | – |
| Redfield & Wilton Strategies | Oct 9–10 | 827 (LV) | – | 41%[lower-alpha 32] | 51% | 2% | 1% | – | – |
| YouGov/CBS | Oct 6–9 | 1,190 (LV) | ± 3.3% | 46% | 52% | - | - | 2%[lower-alpha 38] | 0% |
| Baldwin Wallace University | Sep 30 – Oct 8 | 1,134 (LV) | ± 3.2% | 43% | 50% | 1% | 1% | 0%[lower-alpha 39] | 4% |
| Emerson College | Oct 6–7 | 716 (LV) | ± 3.6% | 43%[lower-alpha 15] | 54% | - | - | 2%[lower-alpha 8] | – |
| Redfield & Wilton Strategies | Oct 4–6 | 700 (LV) | ± 3.7% | 42% | 50% | 1% | 0% | 1%[lower-alpha 40] | 6% |
| Opinion Insight/American Action Forum[upper-alpha 6] | Oct 3–6 | 800 (LV) | ± 3.46% | 44%[lower-alpha 15] | 52% | - | - | 2% | 3% |
| Ipsos/Reuters | Sep 29 – Oct 6 | 709 (LV) | ± 4.2% | 43% | 51% | - | - | 2%[lower-alpha 41] | 3% |
| Change Research/CNBC | Oct 2–4 | 676 (LV) | – | 43% | 51% | - | - | – | – |
| Glengariff Group/Detroit News | Sep 30 – Oct 3 | 600 (LV) | ± 4% | 39% | 48% | - | - | 5%[lower-alpha 42] | 7% |
| Public Policy Polling/Progress Michigan[upper-alpha 2] | Sep 30 – Oct 1 | 746 (V) | – | 44% | 50% | 2% | 1% | – | 3% |
| SurveyMonkey/Axios | Sep 1–30 | 3,297 (LV) | – | 44% | 53% | - | - | – | 3% |
| Trafalgar Group/Restoration PAC[upper-alpha 4] | Sep 26–28 | 1,042 (LV) | ± 2.95% | 47% | 49% | 2% | 0% | 1%[lower-alpha 24] | 2% |
| Redfield & Wilton Strategies | Sep 23–26 | 785 (LV) | ± 3.5% | 42% | 51% | 1% | 0% | 0%[lower-alpha 43] | 6% |
| Marist College/NBC | Sep 19–23 | 799 (LV) | ± 4.3% | 44% | 52% | - | - | 1% | 3% |
| ALG Research/Committee to Protect Medicare[upper-alpha 7] | Sep 17–23 | 800 (LV) | ± 3.5% | 44% | 52% | - | - | – | – |
| Trafalgar Group | Sep 20–22 | 1,015 (LV) | ± 2.99% | 46.7% | 46.0% | 2.1% | 0.8% | 1.2%[lower-alpha 44] | 3.2% |
| Baldwin Wallace University | Sep 9–22 | 1,001 (LV) | ± 3.6% | 42% | 50% | 1% | 0% | 1%[lower-alpha 45] | 6% |
| YouGov/UW-Madison Elections Research Center/Wisconsin State Journal |
Sep 10–21 | 641 (LV) | – | 45% | 51% | - | - | – | – |
| Change Research/CNBC | Sep 18–20 | 568 (LV) | – | 43% | 51% | - | - | – | – |
| Hart Research Associates/Human Rights Campaign[upper-alpha 8] | Sep 17–19 | 400 (LV) | ± 4.9% | 45% | 50% | - | - | – | – |
| Data for Progress (D) | Sep 14–19 | 455 (LV) | ± 4.6% | 42%[lower-alpha 9] | 48% | 1% | 0% | – | 9% |
| 44%[lower-alpha 46] | 50% | - | - | – | 6% | ||||
| MRG | Sep 14–19 | 600 (LV) | ± 4% | 41% | 46% | - | - | 8%[lower-alpha 47] | 5% |
| Ipsos/Reuters | Sep 11–16 | 637 (LV) | ± 4.4% | 44% | 49% | - | - | 2%[lower-alpha 41] | 4% |
| Civiqs/Rust Belt Rising[upper-alpha 5] | Sep 11–15 | 517 (RV) | – | 42% | 53% | - | - | 3%[lower-alpha 16] | 1% |
| Redfield & Wilton Strategies | Sep 12–14 | 930 (LV) | ± 3.21% | 39% | 49% | 2% | 1% | 0%[lower-alpha 43] | 9% |
| EPIC-MRA | Sep 10–15 | 600 (LV) | ± 4% | 40% | 48% | - | - | 5%[lower-alpha 33] | 7%[lower-alpha 23] |
| Benenson Strategy Group/GS Strategy Group/AARP | Aug 28 – Sep 8 | 1,600 (LV) | ± 2.5% | 43% | 50% | - | - | 1%[lower-alpha 48] | 5% |
| Morning Consult | Aug 29 – Sep 7 | 1,455 (LV) | ± (2%–4%) | 42%[lower-alpha 49] | 52% | - | - | – | – |
| Change Research/CNBC | Sep 4–6 | 876 (LV) | – | 43% | 49% | - | - | 7%[lower-alpha 50] | – |
| Pulse Opinion Research/Rasmussen Reports | Sep 2–3 | 1,000 (LV) | ± 3% | 44%[lower-alpha 15] | 53% | - | - | 3%[lower-alpha 51] | – |
| Glengariff Group | Sep 1–3 | 600 (LV) | ± 4% | 42% | 47% | - | - | 4%[lower-alpha 52] | 7% |
| Redfield & Wilton Strategies | Aug 30 – Sep 3 | 967 (LV) | ± 3.15% | 40% | 51% | 1% | 0% | 1%[lower-alpha 40] | 7% |
| Opinion Insight/American Action Forum[upper-alpha 6] | Aug 30 – Sep 2 | 802 (LV) | ± 3.46% | 44%[lower-alpha 15] | 51% | 2% | 1% | 0%[lower-alpha 53] | 3% |
| SurveyMonkey/Axios | Aug 1–31 | 2,962 (LV) | – | 48% | 49% | - | - | – | 3% |
| Morning Consult | Aug 21–30 | 1,424 (LV) | ± (2%–4%) | 42% | 52% | - | - | – | – |
| Public Policy Polling/Progress Michigan[upper-alpha 2] | Aug 28–29 | 897 (V) | – | 44% | 48% | 3% | 1% | – | 3% |
| Change Research/CNBC | Aug 21–23 | 809 (LV) | – | 44% | 50% | - | - | – | – |
| Trafalgar Group | Aug 14–23 | 1,048 (LV) | ± 2.98% | 47% | 45% | 3% | - | 1%[lower-alpha 54] | 4% |
| Redfield and Wilton Strategies | Aug 16–19 | 812 (LV) | – | 38% | 50% | 1% | 1% | 1%[lower-alpha 55] | 9% |
| Civiqs/Rust Belt Rising[upper-alpha 5] | Aug 13–17 | 631 (RV) | – | 46% | 49% | - | - | 3%[lower-alpha 16] | 1% |
| Morning Consult | Aug 7–16 | 1,212 (LV) | ± (2%–4%) | 44% | 50% | - | - | – | – |
| Hodas & Associates/Restoration PAC[upper-alpha 4] | Aug 11–15 | 600 (LV) | – | 41% | 52% | - | - | – | 7% |
| Change Research/CNBC | Aug 7–9 | 413 (LV) | – | 43% | 48% | - | - | – | – |
| YouGov/University of Wisconsin-Madison | Jul 27 – Aug 6 | 761 (RV) | ± 5.1% | 43% | 47% | - | - | 5%[lower-alpha 56] | 6% |
| GQR Research/Unite the Country PAC[upper-alpha 9] | Jul 30 – Aug 4 | 1,245 (LV) | – | 43% | 52% | - | - | – | – |
| David Binder Research | Jul 30–31 | 200 (LV) | – | 41% | 51% | - | - | – | – |
| SurveyMonkey/Axios | Jul 1–31 | 3,083 (LV) | – | 48% | 49% | - | - | – | 2% |
| EPIC-MRA | Jul 25–30 | 600 (LV) | ± 4.0% | 40% | 51% | 3% | - | - | 6% |
| Public Policy Polling/Progress Michigan[upper-alpha 2] | Jul 28–29 | 876 (V) | – | 43% | 49% | - | - | 6%[lower-alpha 57] | 3% |
| Change Research/CNBC | Jul 24–26 | 413 (LV) | – | 42% | 46% | - | - | – | – |
| Morning Consult | Jul 17–26 | 1,320 (LV) | ± 2.7% | 42% | 52% | - | - | – | – |
| YouGov/CBS | Jul 21–24 | 1,156 (LV) | ± 3.4% | 42% | 48% | - | - | 2%[lower-alpha 58] | 7% |
| Redfield & Wilton Strategies | Jul 19–24 | 811 (LV) | – | 37% | 49% | 1% | 1% | 2%[lower-alpha 59] | 10% |
| CNN/SSRS | Jul 18–24 | 927 (RV) | ± 3.8% | 40% | 52% | - | - | 5%[lower-alpha 60] | 2% |
| Gravis Marketing | Jul 22 | 754 (RV) | ± 3.6% | 42% | 51% | - | - | – | 7% |
| Fox News | Jul 18–20 | 756 (RV) | ± 3.5% | 40% | 49% | - | - | 4%[lower-alpha 61] | 7% |
| Hodas & Associates/Restoration PAC[upper-alpha 4] | Jul 13–16 | 600 (LV) | ± 4.0% | 41% | 53% | - | - | – | 7% |
| Spry Strategies/American Principles Project[upper-alpha 10] | Jul 11–16 | 600 (LV) | ± 3.7% | 50% | 45% | - | - | – | 5% |
| Change Research/CNBC | Jul 10–12 | 824 (LV) | – | 42% | 48% | - | - | – | – |
| Public Policy Polling/Giffords (D)[upper-alpha 11] | Jul 9–10 | 1,041 (V) | ± 3.2% | 44% | 51% | - | - | – | 5% |
| SurveyMonkey/Axios | Jun 8–30 | 1,238 (LV) | – | 46% | 51% | - | - | – | 3% |
| Change Research/CNBC | Jun 26–28 | 699 (LV)[lower-alpha 32] | – | 43% | 48% | - | - | – | – |
| Public Policy Polling/Progress Michigan (D)[upper-alpha 2] | Jun 26–27 | 1,237 (V) | – | 44% | 50% | - | - | 5%[lower-alpha 62] | 1% |
| Hodas & Associates/Restoration PAC (R) | Jun 17–20 | 600 (LV) | ± 4.0% | 38% | 56% | - | - | 2%[lower-alpha 63] | 7% |
| Trafalgar Group | Jun 16–18 | 1,101 (LV) | ± 2.95% | 45% | 46% | - | - | 5%[lower-alpha 33] | 4% |
| NYT Upshot/Siena College | Jun 8–17 | 610 (RV) | ± 4.3% | 36% | 47% | - | - | 8%[lower-alpha 64] | 9% |
| Redfield & Wilton Strategies | Jun 14–16 | 826 (LV) | ± 3.41% | 36% | 47% | 2% | 1% | 2%[lower-alpha 65] | 12% |
| TargetPoint | Jun 11–16 | 1,000 (A) | – | 33% | 49% | - | - | 4%[lower-alpha 66] | 14% |
| Change Research/CNBC | Jun 12–14 | 353 (LV)[lower-alpha 32] | – | 45% | 47% | - | - | 3%[lower-alpha 67] | – |
| TIPP/American Greatness PAC Archived June 16, 2020, at the Wayback Machine[upper-alpha 1] | Jun 9–12 | 859 (LV) | – | 38% | 51% | - | - | 4%[lower-alpha 68] | 7% |
| Kiaer Research | May 31 – Jun 7 | 543 (LV) | ± 6.4% | 35% | 50% | - | - | 6%[lower-alpha 69] | 8% |
| EPIC-MRA | May 31 – Jun 4 | 600 (LV) | ± 4% | 39% | 55% | - | - | – | – |
| EPIC-MRA | May 30 – Jun 3 | 600 (LV) | ± 4% | 41% | 53% | - | - | – | 6%[lower-alpha 23] |
| Change Research/CNBC | May 29–31 | 620 (LV)[lower-alpha 32] | – | 46% | 48% | - | - | 3% | 3% |
| Public Policy Polling/Progress Michigan[upper-alpha 2] | May 29–30 | 1,582 (V) | ± 2.5% | 44% | 50% | - | - | 4%[lower-alpha 70] | 2% |
| Morning Consult | May 17–26 | 1,325 (LV) | – | 42% | 50% | - | - | – | – |
| Public Policy Polling/Protect Our Care[upper-alpha 12] | May 18–19 | 1,234 (V) | ± 2.8% | 45% | 51% | - | - | – | 5% |
| Change Research/Crooked Media | May 11–17 | 3,070 (LV) | – | 46% | 49% | - | - | – | – |
| Redfield & Wilton Strategies | May 10–14 | 970 (LV) | ± 3.2% | 39% | 47% | - | - | 3%[lower-alpha 71] | 11% |
| Hodas & Associates/Restoration PAC (R) | May 1–5 | 600 (LV) | ± 3% | 42% | 50% | - | - | – | 8% |
| Public Policy Polling[upper-alpha 13] | Apr 28–29 | 1,270 (V) | – | 42% | 50% | - | - | – | 8% |
| Public Policy Polling[upper-alpha 14] | Apr 20–21 | 1,277 (RV) | – | 44% | 51% | - | - | – | 5% |
| Fox News | Apr 18–21 | 801 (RV) | ± 3.5% | 41% | 49% | - | - | 3% | 6% |
| Ipsos/Reuters | Apr 15–20 | 612 (RV) | ± 5.0% | 38% | 46% | - | - | – | – |
| Hodas & Associates/Restoration PAC (R) | Apr 9–11 | 600 (RV) | ± 3.0% | 43% | 49% | - | - | – | – |
| Hart Research/CAP Action[upper-alpha 15] | Apr 6–8 | 303 (RV) | – | 41% | 50% | - | - | 4% | 5% |
| Public Policy Polling | Mar 31 – Apr 1 | 1,019 (RV) | ± 3.1% | 45% | 48% | - | - | – | 7% |
| SPRY Strategies | Mar 30 – Apr 1 | 602 (LV) | ± 4.0% | 46% | 46% | - | - | – | 8% |
| Baldwin Wallace University Great Lakes | Mar 17–25 | 997 (RV) | ± 3.7% | 42% | 47% | - | - | – | 11% |
| Change Research | Mar 21–23 | 510 (LV) | – | 47% | 48% | - | - | 5% | |
| Marketing Resource Group | Mar 16–20 | 600 (LV) | ± 4.0% | 41% | 44% | - | - | 9%[lower-alpha 72] | 6% |
| Hodas & Associates/Restoration PAC (R) | Mar 12–16 | 600 (RV) | – | 44% | 50% | - | - | – | – |
| AtlasIntel | Mar 7–9 | 1,100 (RV) | ± 3.0% | 46% | 44% | - | - | 10% | – |
| YouGov/Yahoo News | Mar 6–8 | 566 (RV) | – | 41% | 45% | - | - | 6%[lower-alpha 73] | 7% |
| Monmouth University | Mar 5–8 | 977 (RV) | ± 3.1% | 41% | 48% | - | - | 2% | 9% |
| Firehouse Strategies/Øptimus Archived December 9, 2019, at the Wayback Machine | Mar 5–7 | 550 (RV) | ± 5.3% | 46% | 44% | - | - | – | – |
| YouGov | Feb 11–20 | 1,249 (RV) | ± 4.0% | 43% | 47% | - | - | – | – |
| Quinnipiac University Archived May 13, 2020, at the Wayback Machine | Feb 12–18 | 845 (RV) | ± 3.4% | 43% | 47% | - | - | 6%[lower-alpha 74] | 3% |
| Expedition Strategies/Progressive Policies Institute | Feb 6–18 | 500 (RV) | – | 43% | 43% | - | - | – | 14% |
| EPIC-MRA/Detroit Free Press | Jan 9–12 | 600 (LV) | ± 4% | 44% | 50% | - | - | – | 6% |
| Glengariff Group Inc. | Jan 3–7 | 600 (LV) | ± 4% | 43% | 50% | - | - | – | 5% |
2017–2019 polls
| Poll source | Date(s) administered |
Sample size[lower-alpha 6] |
Margin of error |
Donald Trump Republican |
Joe Biden Democratic |
Other | Undecided |
|---|---|---|---|---|---|---|---|
| Firehouse Strategies/Øptimus Archived December 9, 2019, at the Wayback Machine | Dec 3–5, 2019 | 551 (LV) | ± 4.3% | 46% | 41% | 8% [lower-alpha 75] | 5% [lower-alpha 23] |
| Emerson College | Oct 31 – Nov 3, 2019 | 1,051 (RV) | ± 3.0% | 44% | 56% | – | – |
| NYT Upshot/Siena College | Oct 13–25, 2019 | 501 (LV) | ± 5.1% | 44% | 45% | – | – |
| Target Insyght | Sep 24–26, 2019 | 800 (LV) | – | 35% | 54% | – | – |
| Firehouse Strategies/Øptimus | Sep 7–9, 2019 | 529 (LV) | ± 4.0% | 41% | 42% | 17% | – |
| EPIC-MRA | Aug 17–21, 2019 | 600 (LV) | ± 4.0% | 41% | 51% | – | 8% |
| Climate Nexus | Jul 14–17, 2019 | 820 (RV) | ± 4.0% | 36% | 49% | 5%[lower-alpha 76] | 10% |
| Firehouse Strategies/Øptimus | Jun 11–13, 2019 | 587 (LV) | ± 4.2% | 43% | 46% | 11% | – |
| EPIC-MRA | Jun 8–12, 2019 | 600 (LV) | ± 4.0% | 41% | 52% | – | 7% |
| Glengariff Group | May 28–30, 2019 | 600 (LV) | ± 4.0% | 41% | 53% | – | 4% |
| WPA Intelligence | Apr 27–30, 2019 | 200 (LV) | ± 6.9% | 42% | 45% | – | 12% |
| Firehouse Strategies/Øptimus | Mar 19–21, 2019 | 530 (LV) | ± 4.5% | 46% | 45% | 4% | – |
| Emerson College | Mar 7–10, 2019 | 743 (RV) | ± 3.5% | 46% | 54% | – | – |
| Glengariff Group Archived April 22, 2019, at the Wayback Machine | Jan 24–26, 2019 | 600 (LV) | ± 4.0% | 40% | 53% | – | 5% |
| EPIC-MRA | Apr 28–30, 2018 | 600 (LV) | ± 4.0% | 39% | 52% | – | 9% |
| Zogby Analytics | Sep 2017 | 800 (V) | – | 35% | 52% | – | 13% |
Former candidates | ||||||||||||||||||||||||||||||||||||||||||||||||||||||||||||||||||||||||||||||||||||||||||||||||||||||||||||||||||||||||||||||||||||||||||||||||||||||||||||||||||||||||||||||||||||||||||||||||||||||||||||||||||||||||||||||||||||||||||||||||||||||||||||||||||||||||||||||||||||||||||||||||||||||||||||||||||||||||||||||||||||||||||||||||||||||||||||||||||||||||||||||||||||||||||||||||||||||||||||||||||||||||||||||||||||||||||||||||||||||||||||||||||||||||||||||||||||||||||||||||||||||||||||||||||||||||||||||||||||||||||||||||||||||||||||||||||||||||||||||||||||||||||||||||
|---|---|---|---|---|---|---|---|---|---|---|---|---|---|---|---|---|---|---|---|---|---|---|---|---|---|---|---|---|---|---|---|---|---|---|---|---|---|---|---|---|---|---|---|---|---|---|---|---|---|---|---|---|---|---|---|---|---|---|---|---|---|---|---|---|---|---|---|---|---|---|---|---|---|---|---|---|---|---|---|---|---|---|---|---|---|---|---|---|---|---|---|---|---|---|---|---|---|---|---|---|---|---|---|---|---|---|---|---|---|---|---|---|---|---|---|---|---|---|---|---|---|---|---|---|---|---|---|---|---|---|---|---|---|---|---|---|---|---|---|---|---|---|---|---|---|---|---|---|---|---|---|---|---|---|---|---|---|---|---|---|---|---|---|---|---|---|---|---|---|---|---|---|---|---|---|---|---|---|---|---|---|---|---|---|---|---|---|---|---|---|---|---|---|---|---|---|---|---|---|---|---|---|---|---|---|---|---|---|---|---|---|---|---|---|---|---|---|---|---|---|---|---|---|---|---|---|---|---|---|---|---|---|---|---|---|---|---|---|---|---|---|---|---|---|---|---|---|---|---|---|---|---|---|---|---|---|---|---|---|---|---|---|---|---|---|---|---|---|---|---|---|---|---|---|---|---|---|---|---|---|---|---|---|---|---|---|---|---|---|---|---|---|---|---|---|---|---|---|---|---|---|---|---|---|---|---|---|---|---|---|---|---|---|---|---|---|---|---|---|---|---|---|---|---|---|---|---|---|---|---|---|---|---|---|---|---|---|---|---|---|---|---|---|---|---|---|---|---|---|---|---|---|---|---|---|---|---|---|---|---|---|---|---|---|---|---|---|---|---|---|---|---|---|---|---|---|---|---|---|---|---|---|---|---|---|---|---|---|---|---|---|---|---|---|---|---|---|---|---|---|---|---|---|---|---|---|---|---|---|---|---|---|---|---|---|---|---|---|---|---|---|---|---|---|---|---|---|---|---|---|---|---|---|---|---|---|---|---|---|---|---|---|---|---|---|---|---|---|---|---|---|---|---|---|---|---|---|---|---|---|---|---|---|---|---|---|---|---|---|---|---|---|---|---|---|---|---|---|---|---|---|---|---|---|---|---|---|---|---|---|---|---|---|---|---|---|---|---|---|---|---|---|---|---|---|---|---|---|---|---|---|---|---|---|---|---|---|---|---|---|---|---|---|---|---|---|---|---|---|---|---|---|---|---|---|---|---|---|---|---|---|---|---|---|---|---|---|---|---|---|---|---|---|---|---|---|---|---|---|---|---|---|---|---|---|---|---|---|---|---|---|---|---|---|---|---|
|
Donald Trump vs. Michael Bloomberg
Donald Trump vs. Cory Booker
Donald Trump vs. Pete Buttigieg
Donald Trump vs. Kamala Harris
Donald Trump vs. Amy Klobuchar
Donald Trump vs. Beto O'Rourke
Donald Trump vs. Bernie Sanders
Donald Trump vs. Elizabeth Warren
|
Hypothetical polling | |||||||||||||||||||||||||||||||||||||||||||||||||||||||||||||||||||||||||||||||||||||||||||||||||||||||||||||||||||||||||||||||||||||||||||
|---|---|---|---|---|---|---|---|---|---|---|---|---|---|---|---|---|---|---|---|---|---|---|---|---|---|---|---|---|---|---|---|---|---|---|---|---|---|---|---|---|---|---|---|---|---|---|---|---|---|---|---|---|---|---|---|---|---|---|---|---|---|---|---|---|---|---|---|---|---|---|---|---|---|---|---|---|---|---|---|---|---|---|---|---|---|---|---|---|---|---|---|---|---|---|---|---|---|---|---|---|---|---|---|---|---|---|---|---|---|---|---|---|---|---|---|---|---|---|---|---|---|---|---|---|---|---|---|---|---|---|---|---|---|---|---|---|---|---|---|
|
with Donald Trump, Joe Biden, and Justin Amash
with Donald Trump, Joe Biden, and Howard Schultz
with Donald Trump, Bernie Sanders, and Howard Schultz
with Donald Trump and Generic Democrat
with Donald Trump and Generic Opponent
|
General election results
| Party | Candidate | Votes | % | ±% | |
|---|---|---|---|---|---|
| Democratic | Joe Biden Kamala Harris |
2,804,040 | 50.62% | +3.35% | |
| Republican | Donald Trump Mike Pence |
2,649,852 | 47.84% | +0.34% | |
| Libertarian | Jo Jorgensen Spike Cohen |
60,381 | 1.09% | -2.50% | |
| Green | Howie Hawkins Angela Walker |
13,718 | 0.25% | -0.82% | |
| Constitution | Don Blankenship William Mohr |
7,235 | 0.13% | N/A | |
| Natural Law | Rocky De La Fuente Darcy Richardson |
2,986 | 0.05% | N/A | |
| Write-in | Brian T. Carroll | 963 | 0.02% | +0.01% | |
| Write-in | Jade Simmons | 89 | <0.01% | N/A | |
| Write-in | Tom Hoefling | 32 | <0.01% | N/A | |
| Write-in | 6 | <0.01% | N/A | ||
| Total votes | 5,539,302 | 100.00% | |||
By county
| County | Joe Biden Democratic | Donald Trump Republican | Jo Jorgensen Libertarian | Other votes | Total votes | ||||
|---|---|---|---|---|---|---|---|---|---|
| % | # | % | # | % | # | % | # | ||
| Alcona | 30.32% | 2,142 | 68.63% | 4,848 | 0.71% | 50 | 0.34% | 23 | 7,063 |
| Alger | 39.98% | 2,053 | 58.70% | 3,014 | 0.80% | 41 | 0.53% | 27 | 5,135 |
| Allegan | 36.39% | 24,449 | 61.60% | 41,392 | 1.40% | 943 | 0.61% | 298 | 67,082 |
| Alpena | 35.32% | 6,000 | 62.91% | 10,686 | 1.30% | 220 | 0.48% | 81 | 16,987 |
| Antrim | 37.32% | 5,960 | 61.03% | 9,748 | 1.18% | 189 | 0.47% | 75 | 15,972 |
| Arenac | 31.38% | 2,774 | 67.07% | 5,928 | 1.10% | 97 | 0.45% | 40 | 8,839 |
| Baraga | 36.52% | 1,478 | 62.07% | 2,512 | 0.77% | 31 | 0.64% | 26 | 4,047 |
| Barry | 32.80% | 11,797 | 65.27% | 23,471 | 1.33% | 479 | 0.60% | 214 | 35,961 |
| Bay | 43.34% | 26,151 | 54.90% | 33,125 | 1.14% | 688 | 0.61% | 369 | 60,333 |
| Benzie | 44.69% | 5,480 | 53.83% | 6,601 | 1.04% | 128 | 0.43% | 53 | 12,262 |
| Berrien | 45.34% | 37,438 | 52.71% | 43,519 | 1.29% | 1,062 | 0.66% | 546 | 82,565 |
| Branch | 29.94% | 6,159 | 68.36% | 14,064 | 1.05% | 216 | 0.65% | 134 | 20,573 |
| Calhoun | 43.57% | 28,877 | 54.65% | 36,221 | 1.34% | 890 | 0.44% | 293 | 66,281 |
| Cass | 34.79% | 9,130 | 63.63% | 16,699 | 1.09% | 286 | 0.48% | 127 | 26,242 |
| Charlevoix | 40.75% | 6,939 | 57.79% | 9,841 | 0.94% | 160 | 0.53% | 90 | 17,030 |
| Cheboygan | 34.22% | 5,437 | 64.10% | 10,186 | 1.23% | 196 | 0.45% | 71 | 15,890 |
| Chippewa | 37.62% | 6,648 | 60.44% | 10,681 | 1.32% | 233 | 0.62% | 109 | 17,671 |
| Clare | 31.91% | 5,199 | 66.65% | 10,861 | 0.99% | 162 | 0.45% | 73 | 16,295 |
| Clinton | 45.84% | 21,968 | 52.37% | 25,098 | 1.38% | 659 | 0.42% | 202 | 47,927 |
| Crawford | 33.99% | 2,672 | 64.71% | 5,087 | 0.88% | 69 | 0.42% | 33 | 7,861 |
| Delta | 35.93% | 7,606 | 62.39% | 13,207 | 1.18% | 249 | 0.50% | 105 | 21,167 |
| Dickinson | 32.46% | 4,744 | 65.80% | 9,617 | 1.28% | 187 | 0.46% | 67 | 14,615 |
| Eaton | 48.66% | 31,299 | 49.43% | 31,798 | 1.39% | 895 | 0.52% | 335 | 64,327 |
| Emmet | 43.50% | 9,662 | 54.64% | 12,135 | 1.28% | 284 | 0.58% | 128 | 22,209 |
| Genesee | 53.84% | 119,390 | 44.51% | 98,714 | 1.01% | 2,234 | 0.64% | 1,426 | 221,764 |
| Gladwin | 30.95% | 4,524 | 67.69% | 9,893 | 0.97% | 142 | 0.38% | 56 | 14,615 |
| Gogebic | 43.14% | 3,570 | 55.58% | 4,600 | 0.81% | 67 | 0.47% | 39 | 8,276 |
| Grand Traverse | 47.53% | 28,683 | 50.54% | 30,502 | 1.32% | 796 | 0.62% | 372 | 60,353 |
| Gratiot | 34.95% | 6,693 | 63.20% | 12,102 | 1.25% | 240 | 0.59% | 113 | 19,148 |
| Hillsdale | 25.25% | 5,883 | 73.11% | 17,037 | 1.12% | 261 | 0.52% | 121 | 23,302 |
| Houghton | 41.82% | 7,750 | 56.00% | 10,378 | 1.54% | 285 | 0.64% | 120 | 18,533 |
| Huron | 29.77% | 5,490 | 69.03% | 12,731 | 0.79% | 145 | 0.41% | 76 | 18,442 |
| Ingham | 65.18% | 94,212 | 32.96% | 47,639 | 1.30% | 1,873 | 0.58% | 826 | 144,550 |
| Ionia | 33.84% | 10,901 | 64.13% | 20,657 | 1.52% | 490 | 0.50% | 161 | 32,209 |
| Iosco | 34.92% | 5,373 | 63.42% | 9,759 | 0.99% | 152 | 0.67% | 103 | 15,387 |
| Iron | 36.69% | 2,493 | 62.05% | 4,216 | 0.79% | 54 | 0.47% | 32 | 6,795 |
| Isabella | 47.74% | 14,072 | 50.26% | 14,815 | 1.24% | 365 | 0.76% | 224 | 29,476 |
| Jackson | 39.49% | 31,995 | 58.47% | 47,372 | 1.37% | 1,113 | 0.66% | 534 | 81,014 |
| Kalamazoo | 58.22% | 83,686 | 39.53% | 56,823 | 1.44% | 2,064 | 0.81% | 1,173 | 143,746 |
| Kalkaska | 28.24% | 3,002 | 69.95% | 7,436 | 1.34% | 142 | 0.48% | 51 | 10,631 |
| Kent | 51.91% | 187,915 | 45.78% | 165,741 | 1.52% | 5,495 | 0.79% | 2,880 | 362,031 |
| Keweenaw | 43.16% | 672 | 55.36% | 862 | 1.09% | 17 | 0.39% | 6 | 1,557 |
| Lake | 36.13% | 2,288 | 62.32% | 3,946 | 1.03% | 65 | 0.52% | 33 | 6,332 |
| Lapeer | 31.04% | 16,367 | 67.29% | 35,482 | 1.09% | 573 | 0.59% | 310 | 52,732 |
| Leelanau | 52.04% | 8,795 | 46.84% | 7,916 | 0.79% | 134 | 0.33% | 55 | 16,900 |
| Lenawee | 39.13% | 20,918 | 59.01% | 31,541 | 1.29% | 690 | 0.57% | 303 | 53,452 |
| Livingston | 37.91% | 48,220 | 60.52% | 76,982 | 1.19% | 1,511 | 0.38% | 484 | 127,197 |
| Luce | 28.00% | 842 | 70.14% | 2,109 | 0.90% | 27 | 0.97% | 29 | 3,007 |
| Mackinac | 37.47% | 2,632 | 61.27% | 4,304 | 0.80% | 56 | 0.47% | 33 | 7,025 |
| Macomb | 45.31% | 223,952 | 53.39% | 263,863 | 0.90% | 4,462 | 0.40% | 1,979 | 494,256 |
| Manistee | 41.60% | 6,107 | 56.69% | 8,321 | 1.05% | 154 | 0.66% | 97 | 14,679 |
| Marquette | 54.50% | 20,465 | 43.37% | 16,286 | 1.36% | 511 | 0.77% | 288 | 37,550 |
| Mason | 39.36% | 6,802 | 59.06% | 10,207 | 0.83% | 143 | 0.76% | 131 | 17,283 |
| Mecosta | 34.98% | 7,375 | 62.93% | 13,267 | 1.44% | 303 | 0.65% | 136 | 21,081 |
| Menominee | 34.20% | 4,316 | 64.31% | 8,117 | 0.99% | 125 | 0.50% | 63 | 12,621 |
| Midland | 41.67% | 20,493 | 56.28% | 27,675 | 1.43% | 701 | 0.62% | 306 | 49,175 |
| Missaukee | 22.47% | 1,967 | 75.93% | 6,648 | 1.27% | 111 | 0.33% | 29 | 8,755 |
| Monroe | 37.78% | 32,980 | 60.39% | 52,722 | 1.24% | 1,086 | 0.59% | 511 | 87,299 |
| Montcalm | 30.19% | 9,703 | 67.88% | 21,815 | 1.33% | 428 | 0.60% | 192 | 32,138 |
| Montmorency | 27.77% | 1,628 | 71.14% | 4,171 | 0.65% | 38 | 0.44% | 26 | 5,863 |
| Muskegon | 49.37% | 45,643 | 48.82% | 45,133 | 1.32% | 1,219 | 0.48% | 449 | 92,444 |
| Newaygo | 28.95% | 7,873 | 69.33% | 18,857 | 1.22% | 331 | 0.50% | 136 | 27,197 |
| Oakland | 56.24% | 434,148 | 42.22% | 325,971 | 0.94% | 7,282 | 0.59% | 4,590 | 771,991 |
| Oceana | 35.11% | 4,944 | 63.15% | 8,892 | 1.18% | 166 | 0.55% | 78 | 14,080 |
| Ogemaw | 29.15% | 3,475 | 69.23% | 8,253 | 1.12% | 134 | 0.49% | 59 | 11,921 |
| Ontonagon | 36.51% | 1,391 | 61.89% | 2,358 | 0.79% | 30 | 0.81% | 31 | 3,810 |
| Osceola | 26.05% | 3,214 | 72.35% | 8,928 | 1.09% | 135 | 0.51% | 63 | 12,340 |
| Oscoda | 27.50% | 1,342 | 71.02% | 3,466 | 0.80% | 39 | 0.68% | 33 | 4,880 |
| Otsego | 32.10% | 4,743 | 66.19% | 9,779 | 1.20% | 177 | 0.51% | 76 | 14,775 |
| Ottawa | 38.35% | 64,705 | 59.81% | 100,913 | 1.37% | 2,315 | 0.46% | 780 | 168,713 |
| Presque Isle | 34.84% | 2,911 | 63.94% | 5,342 | 0.84% | 70 | 0.38% | 32 | 8,355 |
| Roscommon | 34.36% | 5,166 | 64.32% | 9,670 | 0.80% | 121 | 0.51% | 77 | 15,034 |
| Saginaw | 49.37% | 51,088 | 49.08% | 50,785 | 0.97% | 1,007 | 0.58% | 603 | 103,483 |
| Sanilac | 26.58% | 5,966 | 72.15% | 16,194 | 0.95% | 213 | 0.33% | 73 | 22,446 |
| Schoolcraft | 33.49% | 1,589 | 65.12% | 3,090 | 0.84% | 40 | 0.55% | 26 | 4,745 |
| Shiawassee | 39.05% | 15,347 | 58.90% | 23,149 | 1.33% | 524 | 0.71% | 281 | 39,301 |
| St. Clair | 34.02% | 31,363 | 64.19% | 59,185 | 1.20% | 1,109 | 0.59% | 545 | 92,202 |
| St. Joseph | 33.10% | 9,262 | 64.78% | 18,127 | 1.49% | 416 | 0.63% | 176 | 27,981 |
| Tuscola | 29.55% | 8,712 | 68.85% | 20,297 | 1.11% | 327 | 0.49% | 143 | 29,479 |
| Van Buren | 42.92% | 16,803 | 55.16% | 21,591 | 1.29% | 504 | 0.63% | 248 | 39,146 |
| Washtenaw | 72.44% | 157,136 | 25.93% | 56,241 | 0.90% | 1,956 | 0.74% | 1,598 | 216,931 |
| Wayne | 68.32% | 597,170 | 30.27% | 264,553 | 0.75% | 6,567 | 0.65% | 5,728 | 874,018 |
| Wexford | 31.92% | 5,838 | 66.16% | 12,102 | 1.42% | 259 | 0.51% | 93 | 18,292 |
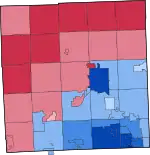
By congressional district
Trump won 8 out of the 14 congressional districts in Michigan.
| District | Trump | Biden | Representative |
|---|---|---|---|
| 1st | 57.9% | 40.6% | Jack Bergman |
| 2nd | 55% | 43.2% | Bill Huizenga |
| 3rd | 50.7% | 47.4% | Justin Amash |
| Peter Meijer | |||
| 4th | 61.1% | 37.2% | John Moolenaar |
| 5th | 47.1% | 51.4% | Dan Kildee |
| 6th | 51.3% | 46.8% | Fred Upton |
| 7th | 56.7% | 41.6% | Tim Walberg |
| 8th | 49.6% | 48.8% | Elissa Slotkin |
| 9th | 42.7% | 55.9% | Andy Levin |
| 10th | 64.2% | 34.4% | Paul Mitchell |
| Lisa McClain | |||
| 11th | 47.1% | 51.6% | Haley Stevens |
| 12th | 34.4% | 64.2% | Debbie Dingell |
| 13th | 20% | 78.8% | Rashida Tlaib |
| 14th | 19.6% | 79.5% | Brenda Lawrence |
Counties that flipped from Republican to Democratic
- Leelanau (largest municipality: Greilickville)
- Kent (largest municipality: Grand Rapids)
- Saginaw (largest municipality: Saginaw)
Jeremy W. Peters of The New York Times wrote that "high Detroit turnout" was a crucial factor aiding Biden.[27] African Americans in Detroit were a major demographic contributing to Joe Biden winning that state.[28] Trump received 12,600 votes in Detroit proper, an increase from the previous election's 7,700. In percentage terms, the shift in Detroit was from Clinton 95–3 to Biden 94–5, a decreased margin from 92 points in 2016 to 89 in 2020. Biden saw increases from 2016 in Oakland and Washtenaw counties.[29]

In Oakland County, Biden won 433,982 votes, making up 56.36% of the votes. The municipalities in Oakland County that majority-voted for Biden versus Trump included Bloomfield Township, Farmington Hills, Madison Heights, Novi, Rochester Hills, Southfield and Troy.[30]
The number of unbalanced votes in Wayne County for 2020 was below the same number for 2016.[31] On November 23, 2020, Michigan certified the results 3–0, with Norm Shinkle abstaining.[32]
Analysis
Michigan was generally seen as one of the most critical states of the 2020 election; the state boasts a highly prized 16 electoral votes, and had been part of the blue wall since Bill Clinton won the state in 1992. It was key to Trump's surprise victory in 2016, and the Biden campaign paid heavy attention to the state throughout the campaign, looking to avoid a repeat of Hillary Clinton's collapse in the northern industrial states.[33][34]
Biden would carry the state by about 2.8% points; while Biden ran well behind Barack Obama in his two campaigns, his margin of victory was in-line for a Democratic candidate, only performing slightly worse than John Kerry's 3.4% margin in 2004, and Al Gore's 5.2% margin in 2000, reflecting some of the steady demographic shifts in the state. Many undecided/third-party voters that had been lost by Clinton appeared to return to the Democratic column, giving Biden enough votes to carry the state.[35]
While Michigan returned to the Democratic column with a fairly sizable margin, the state's internal politics shifted rather dramatically. Trump performed strongly with white voters without a college degree, winning this group by 17 points, and this group made up about 51% of Michigan's electorate, cementing the white-working-class shift to the GOP; with men, this was even more convincing, as Trump carried white men without a college degree by 30 points. On the other hand, there was a significant suburban shift towards the Democrats; for example, Ottawa County, a suburban county outside of Grand Rapids, has traditionally been a GOP-stronghold in the state; Biden cut into Trump's margins here, and Trump carried this county with less than 60%.[35] Trump held Macomb County, which famously helped him clinch Michigan in 2016, but carried it by only 8 points, 3 points fewer than in 2016.[36]
Other demographic patterns remained the same. Biden won 93% of African-American voters in the state; consequently, Biden improved from Clinton's performance in Wayne County, home of Detroit.[36] Biden's performance among black voters would carry on in other parts of the state; Biden was able to match Clinton's performance in Genesee County,[37] and flipped back Saginaw County.[38]
Biden performed strongly with Michigan's different religious groups; Biden was able to improve from Clinton in the vote share with Evangelical Michiganders. More importantly, Biden performed strongly with white Catholics, who make up a large portion of Michigan's electorate.[39] Much of the state's sizable Muslim and Arab American voters backed Biden in the election, in which their support was seen as being important for helping Biden secure victory in Michigan.[40][41]
Aftermath
On November 5, a state judge in Michigan dismissed the Trump campaign's lawsuit requesting a pause in vote-counting to allow access to observers, as the judge noted that vote-counting had already finished in Michigan.[42] That judge also noted the official complaint did not state "why", "when, where, or by whom" an election observer was allegedly blocked from observing ballot-counting in Michigan.[43]
In Antrim County, human error led to a miscount of an unofficial tally of votes for the presidential candidates. The error was caused by a worker using different kinds of ballots when setting up ballot scanners and result-reporting systems, therefore mismatched results were produced. The errors were spotted and rectified, thus the unofficial tally was changed from a Biden victory in the county to a Trump victory.[44]
Despite pressure from the Trump campaign to hand the decision over the state's presidential electors to the Michigan State Legislature, which would have been an unprecedented maneuver in state history, the statewide results were certified in favor of the Biden/Harris ticket on November 23, with one Republican member of the Michigan Board of State Canvassers abstaining.[45]
See also
Notes
- Partisan clients
- The Center for American Greatness is a pro-Trump organization
- Progress Michigan is a non-profit that primarily supports Democratic candidates
- The American Bridge PAC exclusively supports Democratic candidates
- The Restoration PAC is a 501 non-profit which supports Donald Trump's 2020 presidential campaign
- Rust Belt Rising is affiliated with the Democratic Party
- The American Action Forum is a 501 organisation which usually supports Republican candidates
- The Committee to Protect Medicare is a PAC with a history of buying ads arguing against the reelection of Trump
- The Human Rights Campaign endorsed Biden prior to this poll's sampling period
- Unite the Country PAC has endorsed Biden's presidential campaign
- This poll's sponsor is the American Principles Project, a 501(c)(4) organization that supports the Republican Party.
- Poll sponsored by Giffords, whose head - Gabby Giffords - had endorsed Biden prior to the sampling period
- Protect Our Care is a pro-Affordable Care Act organisation
- Poll sponsored by Progress Michigan, the Michigan branch of Progress Now, a progressive advocacy organisation
- Poll sponsored by Protect Our Care, a pro-Affordable Care Act organisation
- CAP Action is a political advocacy group that exclusively supports Democratic candidates
- Poll sponsored by the Sanders campaign
- Voter samples and additional candidates
- Candidate withdrew during absentee voting, following Super Tuesday.
- Candidate withdrew during absentee voting, before Super Tuesday.
- Candidate withdrew during absentee voting, following the New Hampshire primary.
- Candidate withdrew in January, shortly after absentee voting had begun.
- Calculated by taking the difference of 100% and all other candidates combined.
- Key:
A – all adults
RV – registered voters
LV – likely voters
V – unclear - Overlapping sample with the previous SurveyMonkey/Axios poll, but more information available regarding sample size
- "Someone else" with 2%
- Standard VI response
- "Some other candidate" with 2%; West (B) and would not vote with 0%
- If only Biden, Trump and "some other candidate" were available
- "Some other candidate" with 3%; would not vote with 0%
- Results considering those who lean towards a given candidate among those initially predisposed towards abstention, indecision or a candidate besides Biden or Trump in the response section immediately above
- "Some other candidate" with 2%
- With voters who lean towards a given candidate
- "Someone else" with 3%
- "Not sure/Someone else/Undecided" with 8%
- "None of these" with 1%; "Other" with 0%
- "Someone else" with no voters
- Results generated with high Democratic turnout model
- Results generated with high Republican turnout model
- "Third party" with 5%
- Includes "Refused"
- "Someone else" with 1%
- "Other/third party" with 2%
- "Someone else" with 0%
- "Someone else" and would not vote with 0%
- "Third party" with 2%
- "Other" and "None of these" with 0%; would not vote with no voters
- Includes Undecided
- "Other" with 2%; would not vote with no voters
- Additional data sourced from FiveThirtyEight
- "Third party candidate" with 5%
- "Some other candidate" and West (B) with 1%; would not vote with 0%
- "Third party candidate" with 4%
- "Someone else" with 4%
- "Someone else" with 1%; would not vote with 0%
- "Other third party" with 2%
- "Another candidate" with 0%
- "Another Third Party/Write-in" with 1%
- "Some other candidate" with 2%; would not vote with 0%
- "Refused" with 3%; "Third Party" with 2%
- "Another Third Party/Write-in" with 0%
- "Someone else" with 1.2%
- "Another candidate" with 1%
- If only Trump and Biden were candidates
- "Someone else" with 7%; "Refused" with 1%; would not vote with 0%
- Would not vote with 1%
- Overlapping sample with the previous Morning Consult poll, but more information available regarding sample size
- "Other/not sure" with 7%
- "Some other candidate" with 3%
- "Refused" with 3%; "Third party" with 1%
- Would not vote with 0%
- "Another party candidate" with 1%
- "Another third party/write-in" 1%
- "Other" with 3%; would not vote with 2%
- "Third party" with 6%
- "Someone else/third party" with 2%; would not vote with 0%
- "Another Third Party/Write-In" with 2%
- "Other" with 1%; "Neither" with 4%
- "Other" with 3%; would not vote with 1%
- "Would vote third party" with 5%
- "Refused" with 2%
- "Another candidate" with 3%; Would not vote with 5%
- "other" with 2%
- "Refused/no answer" with 4%
- "Libertarian Party candidate/Green Party candidate" with 3%
- "Other" with 4%; "prefer not to answer" with 0%
- "A different candidate" with 6%
- "Third party" with 4%
- "Third party/write-in" with 3%
- "Someone else" with 6%; "Refused" and would not vote with 1%
- "Other" with 4%; would not vote with 2%
- "Someone else" with 2%; would not vote with 4%
- A third party candidate with 5%; would not vote with 3%
- Would not vote with 5%
- "Someone else" with 3%; would not vote with 4%
- Would not vote with 7%
- "Someone else" with 3%; would not vote with 5%
- A third party candidate with 4%; would not vote with 4%
- Would not vote with 6%
- "Other" with 5%; would not vote with 2%
- A third party candidate with 4%; would not vote with 2%
- Would not vote with 4%
- "Someone else" with 2%; would not vote with 5%
- A third party candidate with 3%; would not vote with 5%
- Figures for each candidate in this poll include undecided voters who were reported to lean towards that candidate at the time of polling.
- "It depends on who the Democrats nominate" with 1.9%; "unsure" with 1%
- Listed as "Would vote to replace Trump"
- Listed as "would consider voting for someone other than Trump"
- 19% listed as "would consider voting for someone other than Trump"; 3% as "undecided/refused"
- "Vote to replace Trump" with 45%
- "Consider voting for someone else" with 19%; "Undecided/refused" with 4%
- "Vote to replace Trump" with 49%
- "Consider voting for someone else" with 16%; "Don't know/refused" with 4%
- "Depends on who the Democratic nominee is" with 15%
References
- "Record 5.5M voted in Michigan; highest percentage in decades". Associated Press. November 5, 2020.
- Kelly, Ben (August 13, 2018). "US elections key dates: When are the 2018 midterms and the 2020 presidential campaign?". The Independent. Retrieved January 3, 2019.
- "Distribution of Electoral Votes". National Archives and Records Administration. Retrieved January 3, 2019.
- Shepard, Steven. "Michigan certifies Trump as winner". POLITICO. Retrieved November 10, 2020.
- Coleman, Justine (September 9, 2020). "Biden unveils plan to penalize companies that offshore jobs ahead of Michigan visit". TheHill. Retrieved November 9, 2020.
- "Michigan Voter Surveys: How Different Groups Voted". The New York Times. November 3, 2020. ISSN 0362-4331. Retrieved November 9, 2020.
- "Michigan Will Keep Mark Sanford's Name on the Republican Presidential Primary Unless he Sends in a Withdrawal Letter | Ballot Access News".
- "2020 Michigan Election Results". Michigan Secretary of State. April 30, 2020. Retrieved November 12, 2020.
- Taylor, Kate (February 9, 2019). "Elizabeth Warren Formally Announces 2020 Presidential Bid in Lawrence, Mass". The New York Times. Retrieved February 10, 2019.
- "2020 Michigan Election Results". Michigan Secretary of State. Retrieved June 11, 2020.
- "2020 POTUS Race ratings" (PDF). The Cook Political Report. Retrieved May 21, 2019.
- "POTUS Ratings | Inside Elections". insideelections.com. Retrieved May 21, 2019.
- "Larry J. Sabato's Crystal Ball » 2020 President". crystalball.centerforpolitics.org. Retrieved May 21, 2019.
- "2020 Election Forecast". Politico. November 19, 2019.
- "Battle for White House". RCP. April 19, 2019.
- 2020 Bitecofer Model Electoral College Predictions Archived April 23, 2020, at the Wayback Machine, Niskanen Center, March 24, 2020, retrieved: April 19, 2020
- David Chalian; Terence Burlij. "Road to 270: CNN's debut Electoral College map for 2020". CNN. Retrieved June 16, 2020.
- "Forecasting the US elections". The Economist. Retrieved July 7, 2020.
- "2020 Election Battleground Tracker". CBS News. July 12, 2020. Retrieved July 13, 2020.
- "2020 Presidential Election Interactive Map". 270 to Win.
- "ABC News Race Ratings". CBS News. July 24, 2020. Retrieved July 24, 2020.
- "2020 Electoral Map Ratings: Trump Slides, Biden Advantage Expands Over 270 Votes". NPR.org. Retrieved August 3, 2020.
- "Biden dominates the electoral map, but here's how the race could tighten". NBC News. Retrieved August 6, 2020.
- "2020 Election Forecast". FiveThirtyEight. August 12, 2020. Retrieved August 14, 2020.
- "2020 Michigan Official General Election Results – 11/03/2020". Michigan Secretary of State. Retrieved November 23, 2020.
- "2020 Presidential General Election Results - Michigan". Dave Leip's Atlas of U.S. Presidential Elections. Retrieved November 30, 2020.
- Peters, Jeremy W. (November 4, 2020). "The view in Michigan: Amid ballot-counting, Biden's team is buoyed by high Detroit turnout". The New York Times. Retrieved November 11, 2020.
- Warikoo, Niraj (November 6, 2020). "Black voters in Detroit key for Joe Biden and Gary Peters' victories, advocates say". Detroit Free Press. Retrieved November 11, 2020.
- Garrison, Joey (November 13, 2020). "Donald Trump keeps baselessly claiming voter fraud in cities. But suburbs actually lost him the election". USA Today. Retrieved November 13, 2020.
- Bartkowiak Jr., Dave (November 10, 2020). "How Detroit's Oakland County suburbs voted in 2020 presidential election". Click on Detroit. Retrieved November 24, 2020.
- Ruble, Kayla (November 23, 2020). "Detroit had more vote errors in 2016 when Trump won Michigan by a narrow margin. He didn't object then". The Washington Post. Retrieved November 23, 2020.
- "Michigan board certifies Nov. 3 election, cementing Biden victory".
- Alter, Charlotte (September 15, 2020). "Joe Biden is Running an Invisible Digital Campaign in All-Important Michigan. That's Making Some Democrats Nervous". Time. Retrieved December 15, 2020.
- Emmrich, Stuart (October 28, 2020). "Letter From Michigan: Trying to Win a Key Battleground State for Joe Biden, One Door at a Time". Vogue. Retrieved December 15, 2020.
- Spangler, Todd (November 6, 2020). "Here's how Biden beat Trump in Michigan — and it wasn't corruption". Detroit Free Press. Retrieved December 15, 2020.
- Bartkowiak, Dave (November 11, 2020). "Biden wins big in Wayne, Oakland counties while Trump holds onto Macomb County". ClickOnDetroit. Retrieved December 15, 2020.
- Simpson-Mersha, Isis (November 8, 2020). "See how Genesee County in 2020 voted compared to past elections". MLive. Retrieved December 15, 2020.
- Johnson, Bob (November 4, 2020). "Biden narrowly wins Saginaw County". MLive. Retrieved December 15, 2020.
- "US elections 2020: Trump's support dips among Caucasian evangelical Christians, exit polls show". Middle East Eye. November 6, 2020. Retrieved December 15, 2020.
- Davis, Gabriel (January 19, 2021). "How Arab Americans Helped Decide the U.S. Election". Jadaliyya. Archived from the original on January 18, 2021. Retrieved November 16, 2021.
- Ramey, Elisse (November 7, 2020). "Muslim vote helps secure Michigan for Biden/Harris ticket". ABC12. Archived from the original on November 7, 2020. Retrieved November 16, 2021.
- Egan, Paul (November 5, 2020). "Judge throws out Trump lawsuit over counting of Michigan ballots". Detroit Free Press. Archived from the original on November 8, 2020. Retrieved November 11, 2020.
- Herb, Jeremy; Polantz, Katelyn (November 7, 2020). "'Democracy plain and simple': How the 2020 election defied fraud claims and pandemic fears". CNN. Retrieved November 11, 2020.
- Perlroth, Nicole; Nicas, Jack (November 9, 2020). "No, Software Glitches Are Not Affecting Vote Counts". The New York Times. Archived from the original on November 10, 2020. Retrieved November 11, 2020.
- Mauger, Craig; Nann Burke, Melissa (November 23, 2020). "Michigan board certifies Nov. 3 election, cementing Biden victory". The Detroit News. Retrieved November 23, 2020.
Further reading
- David Weigel; Lauren Tierney (August 9, 2020), "The six political states of Michigan", Washingtonpost.com, archived from the original on September 9, 2020, retrieved September 7, 2020. (Describes 2016 political geography of Detroit; Detroit suburbs; the Middle; the Thumb; the West; Upper Peninsula and North)
- Summary: State Laws on Presidential Electors (PDF), Washington DC: National Association of Secretaries of State, August 2020,
Michigan
- David Wasserman (October 6, 2020), "The 10 Bellwether Counties That Show How Trump Is in Serious Trouble", Nytimes.com. (Describes bellwether Kent County, Michigan)
- Jennifer Steinhauer (October 17, 2020), "In Kalamazoo, Old High School Classmates Reckon With a Divided Country", The New York Times
External links
- "League of Women Voters of Michigan". (State affiliate of the U.S. League of Women Voters)
- Government Documents Round Table of the American Library Association, "Michigan", Voting & Elections Toolkits
- "Michigan: Election Tools, Deadlines, Dates, Rules, and Links", Vote.org, Oakland, CA
- Michigan at Ballotpedia