2019 North Warwickshire Borough Council election
On 2 May 2019, an election took place to elect members of the North Warwickshire Borough Council in England. It was held on the same day as other local elections in the UK. It resulted in the Conservative Party retaining control of the council.
| |||||||||||||||||||||||||||||||||||||||||||||||||||||
All 35 seats to North Warwickshire Borough Council 18 seats needed for a majority | |||||||||||||||||||||||||||||||||||||||||||||||||||||
|---|---|---|---|---|---|---|---|---|---|---|---|---|---|---|---|---|---|---|---|---|---|---|---|---|---|---|---|---|---|---|---|---|---|---|---|---|---|---|---|---|---|---|---|---|---|---|---|---|---|---|---|---|---|
| |||||||||||||||||||||||||||||||||||||||||||||||||||||
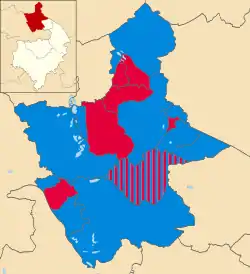 Results of the 2019 North Warwickshire Borough council election. Conservatives in blue and Labour in red. | |||||||||||||||||||||||||||||||||||||||||||||||||||||
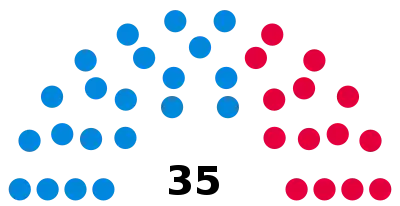 Composition of the council after the election. | |||||||||||||||||||||||||||||||||||||||||||||||||||||
| |||||||||||||||||||||||||||||||||||||||||||||||||||||
Both the Conservative and Labour parties saw increases in their vote share, especially the former, which was likely due to UKIP losing nearly 20% of their vote share. The Conservatives lost one seat to Labour but still retained a majority of seats.[1][2]
Ward results
Arley and Whitacre
| Party | Candidate | Votes | % | ±% | |
|---|---|---|---|---|---|
| Labour | Jodie Gosling | 613 | 49.9 | ||
| Conservative | Kerry Parker | 567 | 46.2 | ||
| Labour | Ann McLauchlan | 562 | 45.8 | ||
| Conservative | Sandra Smith | 523 | 42.6 | ||
| Conservative | Helen Zgraja | 508 | 41.4 | ||
| Labour | Nigel Turley | 484 | 39.4 | ||
| Majority | |||||
| Turnout | 1,228 | ||||
| Labour gain from Conservative | |||||
| Conservative hold | |||||
| Labour gain from Conservative | |||||
Atherstone Central
| Party | Candidate | Votes | % | ±% | |
|---|---|---|---|---|---|
| Labour | Neil Dirveiks | 306 | 47.7 | ||
| Labour | Dawn Downes | 261 | 40.7 | ||
| Conservative | Jodda Jordan | 248 | 38.7 | ||
| Conservative | Daniel Hancocks | 213 | 33.2 | ||
| Green | Luke Haslam | 118 | 18.4 | ||
| Majority | |||||
| Turnout | 641 | ||||
| Labour hold | |||||
| Labour hold | |||||
Atherstone North
| Party | Candidate | Votes | % | ±% | |
|---|---|---|---|---|---|
| Conservative | Ray Jarvis | 403 | 43.2 | ||
| Conservative | Mejar Singh | 371 | 39.8 | ||
| Labour | Sara Bishop | 340 | 36.5 | ||
| Labour | Brian Henney | 333 | 35.7 | ||
| UKIP | Robert Gisbourne | 180 | 19.3 | ||
| UKIP | Richard Freer | 156 | 16.7 | ||
| Majority | |||||
| Turnout | 932 | ||||
| Conservative hold | |||||
| Conservative hold | |||||
Atherstone South and Mancetter
| Party | Candidate | Votes | % | ±% | |
|---|---|---|---|---|---|
| Conservative | Denise Clews | 511 | 58.5 | ||
| Conservative | Tony Clews | 482 | 55.1 | ||
| Labour | Susan Allan-Stubbs | 354 | 40.5 | ||
| Labour | Martin Short | 329 | 37.6 | ||
| Majority | |||||
| Turnout | 874 | ||||
| Conservative hold | |||||
| Conservative hold | |||||
Baddesley and Grendon
| Party | Candidate | Votes | % | ±% | |
|---|---|---|---|---|---|
| Conservative | Andy Wright | 718 | 60.6 | ||
| Conservative | Bernadette Davey | 676 | 57.1 | ||
| Labour | John Moore | 456 | 38.5 | ||
| Labour | Ian Driver | 429 | 36.2 | ||
| Majority | |||||
| Turnout | 1,184 | ||||
| Conservative hold | |||||
| Conservative gain from Labour | |||||
Coleshill North
| Party | Candidate | Votes | % | ±% | |
|---|---|---|---|---|---|
| Labour | Jack Deakin | 433 | 53.9 | ||
| Labour | Jane Farrow | 387 | 48.1 | ||
| Conservative | Richard Habgood | 357 | 44.4 | ||
| Conservative | Julie Hobster | 325 | 40.4 | ||
| Majority | |||||
| Turnout | 804 | ||||
| Labour hold | |||||
| Labour hold | |||||
Coleshill South
| Party | Candidate | Votes | % | ±% | |
|---|---|---|---|---|---|
| Conservative | Caroline Symonds | 552 | 53.5 | ||
| Conservative | Colin Hayfield | 494 | 47.9 | ||
| Labour | Claire Breeze | 378 | 36.7 | ||
| Labour | Chelsea Collis | 332 | 32.2 | ||
| UKIP | David Williams | 123 | 11.9 | ||
| UKIP | Mandy Williams | 107 | 10.4 | ||
| Majority | |||||
| Turnout | 1,031 | ||||
| Conservative hold | |||||
| Conservative hold | |||||
Curdworth
| Party | Candidate | Votes | % | ±% | |
|---|---|---|---|---|---|
| Conservative | Mark Simpson | 668 | 75.4 | ||
| Conservative | Shelly Lebrun | 651 | 73.5 | ||
| Labour | Lauren Naylor | 168 | 19.0 | ||
| Labour | Susan Hammond | 161 | 18.2 | ||
| Majority | |||||
| Turnout | 886 | ||||
| Conservative hold | |||||
| Conservative hold | |||||
Dordon
| Party | Candidate | Votes | % | ±% | |
|---|---|---|---|---|---|
| Labour | Jacky Chambers | 387 | 54.3 | ||
| Labour | Peter Morson | 326 | 45.7 | ||
| Conservative | David Hanratty | 173 | 24.3 | ||
| UKIP | Stuart Taylor | 165 | 23.1 | ||
| Conservative | Dan Welch | 113 | 15.8 | ||
| Majority | |||||
| Turnout | 713 | ||||
| Labour hold | |||||
| Labour hold | |||||
Fillongley
| Party | Candidate | Votes | % | ±% | |
|---|---|---|---|---|---|
| Conservative | Leslie Smith | 610 | 74.5 | ||
| Conservative | David Wright | 542 | 66.2 | ||
| Labour | Susan Kelly | 191 | 23.3 | ||
| Labour | Olwen Dutton | 178 | 21.7 | ||
| Majority | |||||
| Turnout | 819 | ||||
| Conservative hold | |||||
| Conservative hold | |||||
Hartshill
| Party | Candidate | Votes | % | ±% | |
|---|---|---|---|---|---|
| Conservative | Margaret Bell | 458 | 52.5 | ||
| Conservative | Barry Lees | 389 | 44.6 | ||
| Labour | Cerys Howell | 327 | 37.5 | ||
| Labour | Elinor Parsons | 261 | 29.9 | ||
| Green | Ian Bourne | 156 | 17.9 | ||
| Majority | |||||
| Turnout | 872 | ||||
| Conservative hold | |||||
| Conservative gain from Labour | |||||
Hurley and Wood End
| Party | Candidate | Votes | % | ±% | |
|---|---|---|---|---|---|
| Labour | Hayden Phillips | 416 | 54.7 | ||
| Labour | Owen Phillips | 371 | 48.8 | ||
| Conservative | Robert Hobster | 327 | 43.0 | ||
| Conservative | Martin Watson | 320 | 42.0 | ||
| Majority | |||||
| Turnout | 761 | ||||
| Labour hold | |||||
| Labour hold | |||||
Kingsbury
| Party | Candidate | Votes | % | ±% | |
|---|---|---|---|---|---|
| Conservative | Andy Jenns | 752 | 69.4 | ||
| Conservative | Brian Moss | 632 | 58.4 | ||
| Labour | Patrick Silke | 246 | 22.7 | ||
| Independent | Carol Ayasamy | 221 | 20.4 | ||
| Labour | Alexandra Phillips | 218 | 20.1 | ||
| Majority | |||||
| Turnout | 1,083 | ||||
| Conservative hold | |||||
| Conservative gain from Labour | |||||
Newton Regis and Warton
| Party | Candidate | Votes | % | ±% | |
|---|---|---|---|---|---|
| Conservative | John Humphreys | 579 | 56.8 | ||
| Conservative | Marian Humphreys | 561 | 55.0 | ||
| Labour | Fin Wood | 434 | 42.5 | ||
| Labour | Chris Clark | 422 | 41.4 | ||
| Majority | |||||
| Turnout | 1,020 | ||||
| Conservative hold | |||||
| Conservative hold | |||||
Polesworth East
| Party | Candidate | Votes | % | ±% | |
|---|---|---|---|---|---|
| Labour | Dave Parsons | 588 | 69.8 | ||
| Labour | Adam Farrell | 487 | 57.8 | ||
| Conservative | John Smitten | 265 | 31.4 | ||
| Conservative | Karen Tracey | 211 | 25.0 | ||
| Majority | |||||
| Turnout | 843 | ||||
| Labour hold | |||||
| Labour hold | |||||
Polesworth West
| Party | Candidate | Votes | % | ±% | |
|---|---|---|---|---|---|
| Labour | Michael Osborne | 354 | 48.4 | ||
| Labour | Simon Rose | 351 | 48.0 | ||
| Conservative | Sue Hanratty | 346 | 47.3 | ||
| Conservative | Richard Freakley | 339 | 46.4 | ||
| Majority | |||||
| Turnout | 731 | ||||
| Labour hold | |||||
| Labour hold | |||||
Water Orton
| Party | Candidate | Votes | % | ±% | |
|---|---|---|---|---|---|
| Conservative | Dave Reilly | 706 | 70.7 | ||
| Conservative | Judy MacDonald | 676 | 67.7 | ||
| Labour | Daniel Hodkinson | 280 | 28.1 | ||
| Labour | Alistair Brett | 195 | 19.5 | ||
| Majority | |||||
| Turnout | 998 | ||||
| Conservative hold | |||||
| Conservative hold | |||||
References
- "Borough Council Election Results May 2 2019". North Warwickshire Borough Council. Retrieved 1 December 2020.
- "North Warwickshire Borough Council - Election Results for 2019". BBC News. Retrieved 1 December 2020.
This article is issued from Wikipedia. The text is licensed under Creative Commons - Attribution - Sharealike. Additional terms may apply for the media files.