2008 United States presidential election in Oklahoma
The 2008 United States presidential election in Oklahoma took place on November 4, 2008, and was part of the 2008 United States presidential election. Voters chose seven representatives, or electors to the Electoral College, who voted for president and vice president.
| ||||||||||||||||||||||||||
| ||||||||||||||||||||||||||
 County Results
McCain 50-60% 60-70% 70-80% 80-90%
| ||||||||||||||||||||||||||
| ||||||||||||||||||||||||||
| Elections in Oklahoma |
|---|
 |
|
|
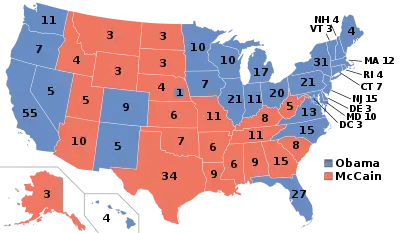
Oklahoma was won by Republican nominee John McCain with a 31.3% margin of victory. Prior to the election, all 17 news organizations considered this a state McCain would win, or otherwise considered as a safe red state. A strongly conservative state located in the Bible Belt where evangelical Christianity plays a large role, Oklahoma has swung and trended more to the Republicans in recent years than any other state. Having voted for the Republican presidential nominee in every election since 1968, Oklahoma once again showcased its status as a Republican stronghold in 2008 with Republican John McCain capturing 65.65% of the vote.[1] It was also the only state where McCain won every county and was even one of the 5 states along with Louisiana, Arkansas, Tennessee, and West Virginia in which McCain outperformed Bush's margin of victory from 4 years earlier, albeit slightly. This was also only the second election since its statehood in which Oklahoma supported a different candidate than Virginia, with 1920 being the first. However, this has happened in all elections since, as Oklahoma has voted consistently Republican while Virginia has voted consistently Democratic.
Primaries
Campaign
Predictions
There were 16 news organizations who made state-by-state predictions of the election. Here are their last predictions before election day:
| Source | Ranking |
|---|---|
| D.C. Political Report[2] | Likely R |
| Cook Political Report[3] | Solid R |
| The Takeaway[4] | Solid R |
| Electoral-vote.com[5] | Solid R |
| Washington Post[6] | Solid R |
| Politico[7] | Solid R |
| RealClearPolitics[8] | Solid R |
| FiveThirtyEight[6] | Solid R |
| CQ Politics[9] | Solid R |
| The New York Times[10] | Solid R |
| CNN[11] | Safe R |
| NPR[6] | Solid R |
| MSNBC[6] | Solid R |
| Fox News[12] | Likely R |
| Associated Press[13] | Likely R |
| Rasmussen Reports[14] | Safe R |
Polling
McCain won every single pre-election poll, and each with a double-digit margin of victory. The final 3 polls averaged McCain leading 62% to 34%.[15]
Fundraising
John McCain raised a total of $2,050,335 in the state. Barack Obama raised $1,711,069.[16]
Analysis
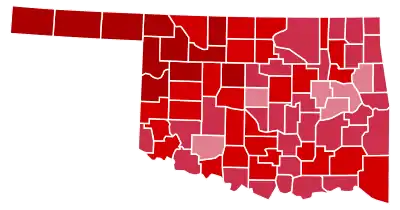
Oklahoma gave John McCain his strongest showing in Election 2008 with a rounded percentage of 66% (65.65%) going to him.[19] The Sooner State was also the only state in the country where every single county voted for McCain. Although the results were similar to 2004 in which George W. Bush swept every county in the state with 65.57% of the vote, McCain's margin of victory was slightly better - 0.08% more - in 2008.[20] Oklahoma was one of five states where McCain outperformed George W. Bush, the other four being Arkansas, Louisiana, Tennessee, and West Virginia.
Oklahoma, despite the large concentration of Native Americans in the state, remains one of the most reliably Republican states in the country. Although Democrats still had a majority of registered voters at the time, the state's Democrats are very conservative by national standards. Oklahoma is part of the Bible Belt, and voters in the state have a strong penchant for being values voters; that is, they are strongly and deeply conservative on social issues such as abortion and gay rights. McCain's selection of the socially conservative Governor Sarah Palin of Alaska proved to be an excellent fit for the Sooner State. Obama was at a disadvantage beforehand in Oklahoma during the primary season when voters in the Sooner State backed Hillary Rodham Clinton with 54.76% of the vote compared to Obama's 31.19% and a significant amount (10.24%) going to John Edwards. Clinton won every county in the Oklahoma Democratic Primary except for Oklahoma County, home of Oklahoma City which Obama just narrowly carried. Most of Oklahoma's Democratic establishment were early endorsers of Hillary Clinton as well. Another setback for Obama was that U.S. Representative Dan Boren, the only Democrat from Oklahoma's five-member delegation in the U.S. House of Representatives, refused to endorse Obama.
Another key to McCain's victory was the highly populated counties of Tulsa County, which he won with over 62%, and Oklahoma County, which he won with over 58%. He also dominated the heavily Republican Oklahoma Panhandle by an almost four-to-one margin. Despite the Republican landslide, Obama did improve upon John Kerry's performance in Oklahoma City and Tulsa. However, this was more than canceled out by his extremely weak showing in Southeast Oklahoma, historically the most Democratic region in the state. This socially conservative but fiscally liberal area, known as "Little Dixie," still votes Democratic at the local level and state levels. It also warmly supported Bill Clinton of neighboring Arkansas in 1992 and 1996; Clinton's populism struck a chord among the region's voters. Democratic nominees from John Kerry on, on the other hand, have proven spectacularly bad fits for the region and the state as a whole. Obama lost many counties in Southeast Oklahoma by more than two-to-one margins.
Also, Oklahoma was the only state in the country that didn't have a third-party candidate on the ballot, mostly because the state has the toughest ballot access laws in the country.
During the same election, incumbent Republican U.S. Senator James Inhofe was solidly reelected over Democratic State Senator Andrew Rice. Inhofe received 56.68% while Rice took in 39.18% and Independent Stephen P. Wallace received the remaining 4.14%. At the state level, Republicans made gains in the Oklahoma Legislature, picking up four seats in the Oklahoma House of Representatives and two seats in the Oklahoma Senate which gave the GOP control of the state legislature for the first time since statehood.
Results
| 2008 United States presidential election in Oklahoma | ||||||
|---|---|---|---|---|---|---|
| Party | Candidate | Running mate | Votes | Percentage | Electoral votes | |
| Republican | John McCain | Sarah Palin | 960,165 | 65.65% | 7 | |
| Democratic | Barack Obama | Joe Biden | 502,496 | 34.35% | 0 | |
| Totals | 1,462,661 | 100.00% | 7 | |||
| Voter turnout (Voting age population) | 54.8% | |||||
Results breakdown
By county
| County | McCain# | McCain% | Obama# | Obama% | Total |
|---|---|---|---|---|---|
| Adair | 4,636 | 69.35% | 2,049 | 30.65% | 6,685 |
| Alfalfa | 2,023 | 83.11% | 411 | 16.89% | 2,434 |
| Atoka | 3,509 | 71.92% | 1,370 | 28.08% | 4,879 |
| Beaver | 2,197 | 89.24% | 265 | 10.76% | 2,462 |
| Beckham | 5,769 | 78.02% | 1,625 | 21.98% | 7,394 |
| Blaine | 3,100 | 75.41% | 1,011 | 24.59% | 4,111 |
| Bryan | 9,295 | 67.76% | 4,423 | 32.24% | 13,718 |
| Caddo | 6,401 | 65.34% | 3,395 | 34.66% | 9,796 |
| Canadian | 36,411 | 76.12% | 11,422 | 23.88% | 47,833 |
| Carter | 13,241 | 70.27% | 5,603 | 29.73% | 18,844 |
| Cherokee | 9,182 | 56.07% | 7,193 | 43.93% | 16,375 |
| Choctaw | 3,729 | 66.73% | 1,859 | 33.27% | 5,588 |
| Cimarron | 1,119 | 88.04% | 152 | 11.96% | 1,271 |
| Cleveland | 64,730 | 62.00% | 39,673 | 38.00% | 104,403 |
| Coal | 1,609 | 73.84% | 570 | 26.16% | 2,179 |
| Comanche | 20,127 | 58.77% | 14,120 | 41.23% | 34,247 |
| Cotton | 1,793 | 72.21% | 690 | 27.79% | 2,483 |
| Craig | 3,858 | 65.06% | 2,072 | 34.94% | 5,930 |
| Creek | 20,181 | 70.81% | 8,318 | 29.19% | 28,499 |
| Custer | 7,842 | 74.67% | 2,660 | 25.33% | 10,502 |
| Delaware | 10,274 | 66.90% | 5,084 | 33.10% | 15,358 |
| Dewey | 1,857 | 84.29% | 346 | 15.71% | 2,203 |
| Ellis | 1,627 | 85.23% | 282 | 14.77% | 1,909 |
| Garfield | 17,066 | 75.48% | 5,545 | 24.52% | 22,611 |
| Garvin | 7,708 | 71.80% | 3,028 | 28.20% | 10,736 |
| Grady | 15,187 | 73.36% | 5,516 | 26.64% | 20,703 |
| Grant | 1,836 | 78.13% | 514 | 21.87% | 2,350 |
| Greer | 1,548 | 73.23% | 566 | 26.77% | 2,114 |
| Harmon | 757 | 69.45% | 333 | 30.55% | 1090 |
| Harper | 1,342 | 85.86% | 221 | 14.14% | 1,563 |
| Haskell | 3,206 | 68.50% | 1,474 | 31.50% | 4,680 |
| Hughes | 3,132 | 64.75% | 1,705 | 35.25% | 4,837 |
| Jackson | 6,716 | 74.80% | 2,263 | 25.20% | 8,979 |
| Jefferson | 1,649 | 67.20% | 805 | 32.80% | 2,454 |
| Johnston | 2,707 | 68.48% | 1,246 | 31.52% | 3,953 |
| Kay | 13,229 | 70.78% | 5,462 | 29.22% | 18,691 |
| Kingfisher | 5,372 | 84.19% | 1,009 | 15.81% | 6,381 |
| Kiowa | 2,536 | 67.41% | 1,226 | 32.59% | 3,762 |
| Latimer | 2,860 | 68.54% | 1,313 | 31.46% | 4,173 |
| LeFlore | 11,603 | 69.32% | 5,136 | 30.68% | 16,739 |
| Lincoln | 10,468 | 74.93% | 3,503 | 25.07% | 13,971 |
| Logan | 12,555 | 68.72% | 5,716 | 31.28% | 18,271 |
| Love | 2,589 | 67.32% | 1,257 | 32.68% | 3,846 |
| Major | 2,955 | 85.16% | 515 | 14.84% | 3,470 |
| Marshall | 3,729 | 69.43% | 1,642 | 30.57% | 5,371 |
| Mayes | 10,231 | 64.02% | 5,749 | 35.98% | 15,980 |
| McClain | 11,184 | 75.91% | 3,550 | 24.09% | 14,734 |
| McCurtain | 7,744 | 73.50% | 2,792 | 26.50% | 10,536 |
| McIntosh | 4,903 | 59.64% | 3,318 | 40.36% | 8,221 |
| Murray | 3,746 | 70.18% | 1,592 | 29.82% | 5,338 |
| Muskogee | 15,276 | 57.51% | 11,286 | 42.49% | 26,562 |
| Noble | 3,881 | 76.78% | 1,174 | 23.22% | 5,055 |
| Nowata | 3,029 | 68.22% | 1,411 | 31.78% | 4,440 |
| Okfuskee | 2,642 | 64.13% | 1,478 | 35.87% | 4,120 |
| Oklahoma | 163,099 | 58.41% | 116,133 | 41.59% | 279,232 |
| Okmulgee | 8,724 | 58.51% | 6,187 | 41.49% | 14,911 |
| Osage | 12,150 | 61.85% | 7,493 | 38.15% | 19,643 |
| Ottawa | 6,904 | 61.81% | 4,266 | 38.19% | 11,170 |
| Pawnee | 4,533 | 68.72% | 2,063 | 31.28% | 6,596 |
| Payne | 18,435 | 63.49% | 10,601 | 36.51% | 29,036 |
| Pittsburg | 11,739 | 68.28% | 5,454 | 31.72% | 17,193 |
| Pontotoc | 9,749 | 68.37% | 4,511 | 31.63% | 14,260 |
| Pottawatomie | 17,728 | 69.16% | 7,906 | 30.84% | 25,634 |
| Pushmataha | 3,208 | 71.72% | 1,265 | 28.28% | 4,473 |
| Roger Mills | 1,502 | 84.00% | 286 | 16.00% | 1,788 |
| Rogers | 27,732 | 72.03% | 10,770 | 27.97% | 38,502 |
| Seminole | 5,599 | 65.29% | 2,977 | 34.71% | 8,576 |
| Sequoyah | 9,465 | 68.00% | 4,454 | 32.00% | 13,919 |
| Stephens | 14,392 | 76.03% | 4,538 | 23.97% | 18,930 |
| Texas | 5,332 | 85.24% | 923 | 14.76% | 6,255 |
| Tillman | 2,195 | 67.81% | 1,042 | 32.19% | 3,237 |
| Tulsa | 158,322 | 62.23% | 96,106 | 37.77% | 254,428 |
| Wagoner | 21,426 | 70.87% | 8,805 | 29.13% | 30,231 |
| Washington | 16,457 | 72.29% | 6,308 | 27.71% | 22,765 |
| Washita | 3,716 | 77.97% | 1,050 | 22.03% | 4,766 |
| Woods | 3,043 | 77.77% | 870 | 22.23% | 3,913 |
| Woodward | 6,402 | 82.61% | 1,348 | 17.39% | 7,750 |
By congressional district
John McCain carried every congressional district in Oklahoma, including the one district held by a Democrat in the U.S. House of Representatives rather strongly.
| District | McCain | Obama | Representative |
|---|---|---|---|
| 1st | 64.21% | 35.79% | John A. Sullivan |
| 2nd | 65.59% | 34.41% | Dan Boren |
| 3rd | 72.82% | 27.18% | Frank Lucas |
| 4th | 66.37% | 33.63% | Tom Cole |
| 5th | 59.32% | 40.68% | Mary Fallin |
Electors
Technically the voters of Oklahoma cast their ballots for electors: representatives to the Electoral College. Oklahoma is allocated 7 electors because it has 5 congressional districts and 2 senators. All candidates who appear on the ballot or qualify to receive write-in votes must submit a list of 7 electors, who pledge to vote for their candidate and his or her running mate. Whoever wins the majority of votes in the state is awarded all 7 electoral votes. Their chosen electors then vote for president and vice president. Although electors are pledged to their candidate and running mate, they are not obligated to vote for them.[21] An elector who votes for someone other than his or her candidate is known as a faithless elector.
The electors of each state and the District of Columbia met on December 15, 2008, to cast their votes for president and vice president. The Electoral College itself never meets as one body. Instead the electors from each state and the District of Columbia met in their respective capitols.
The following were the members of the Electoral College from the state. All 7 were pledged to John McCain and Sarah Palin:[22]
- Virginia Chrisco
- Gail Stice
- Pete Katzdorn
- Robert Cleveland
- Mary Phyllis Gorman
- Bunny Chambers
- Diane Murphy Gunther
The slate for the Democrats, which was not elected, consisted of Sally Freeman Frasier, Gene A. Wallace, Anita R. Norman, Tim Mauldin, Robert Lemon, David Walters, Walter W. Jenny Jr.[23]
References
- "CNN Election Center 2008 - Oklahoma Results". Retrieved May 26, 2010.
- "D.C.'s Political Report: The complete source for campaign summaries". 2009-01-01. Archived from the original on 2009-01-01. Retrieved 2021-08-23.
- "Presidential". 2015-05-05. Archived from the original on 2015-05-05. Retrieved 2021-08-23.
- "Vote 2008 - The Takeaway - Track the Electoral College vote predictions". 2009-04-22. Archived from the original on 2009-04-22. Retrieved 2021-08-23.
- "Electoral-vote.com: President, Senate, House Updated Daily". electoral-vote.com. Retrieved 2021-08-23.
- Based on Takeaway
- "POLITICO's 2008 Swing State Map - POLITICO.com". www.politico.com. Retrieved 2016-09-22.
- "RealClearPolitics - Electoral Map". Archived from the original on 2008-06-05.
- "CQ Presidential Election Maps, 2008". CQ Politics. Archived from the original on June 14, 2009. Retrieved December 20, 2009.
- Nagourney, Adam; Zeleny, Jeff; Carter, Shan (2008-11-04). "The Electoral Map: Key States". The New York Times. Retrieved May 26, 2010.
- "October – 2008 – CNN Political Ticker - CNN.com Blogs". CNN. 2008-10-31. Retrieved May 26, 2010.
- "Winning The Electoral College". Fox News. April 27, 2010.
- "roadto270". hosted.ap.org. Retrieved 2016-09-22.
- "Election 2008: Electoral College Update - Rasmussen Reports™". www.rasmussenreports.com. Retrieved 2016-09-22.
- David Leip. "Election 2008 Polls - Dave Leip's Atlas of U.S. Presidential Elections". Retrieved 14 January 2015.
- "Presidential Campaign Finance". Archived from the original on 24 March 2009. Retrieved 14 January 2015.
- "Map: Campaign Ad Spending - Election Center 2008 from CNN.com". CNN. Retrieved May 26, 2010.
- "Map: Campaign Candidate Visits - Election Center 2008 from CNN.com". CNN. Retrieved May 26, 2010.
- "2008 Presidential Election Statistics". Dave Leip’s Atlas of U.S. Presidential Elections. Retrieved 2018-03-05.
- "CNN Election Center 2004 - Oklahoma Results". Retrieved May 26, 2010.
- "Electoral College". California Secretary of State. Archived from the original on October 30, 2008. Retrieved 2008-11-01.
- "U. S. Electoral College 2008 Election - Certificates". Retrieved 14 January 2015.
- https://www.ok.gov/elections/documents/08electr.pdf