1985 Galway City Council election
An election to Galway City Council took place on 20 June 1985 as part of that year's Irish local elections. 15 councillors were elected from three electoral divisions by PR-STV voting for a six-year term of office.
| |||||||||||||||||||||||||||||||||
All 15 seats to Galway City Council | |||||||||||||||||||||||||||||||||
|---|---|---|---|---|---|---|---|---|---|---|---|---|---|---|---|---|---|---|---|---|---|---|---|---|---|---|---|---|---|---|---|---|---|
| |||||||||||||||||||||||||||||||||
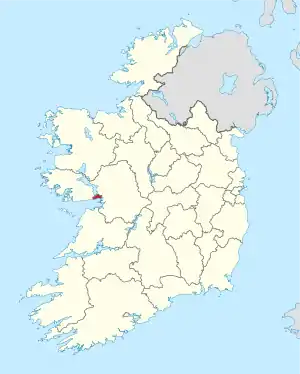 Map showing the area of Galway City Council | |||||||||||||||||||||||||||||||||
| |||||||||||||||||||||||||||||||||
Results by party
| Party | Seats | ± | First Pref. votes | FPv% | ±% | |
|---|---|---|---|---|---|---|
| Fianna Fáil | 6 | - | 5,985 | 40.59 | ||
| Fine Gael | 5 | - | 4,283 | 29.05 | ||
| Workers' Party | 2 | - | 1,323 | 8.97 | ||
| Labour | 1 | - | 1,597 | 10.83 | ||
| Independent | 1 | - | 1,556 | 10.55 | ||
| Totals | 15 | - | 14,744 | 100.0 | — | |
Results by Electoral Area
North & East Ward
| Party | Candidate | FPv% | Count | ||||||||||||||
|---|---|---|---|---|---|---|---|---|---|---|---|---|---|---|---|---|---|
| 1 | 2 | 3 | 4 | 5 | 6 | 7 | 8 | 9 | 10 | 11 | 12 | 13 | 14 | ||||
| Fianna Fáil | Bridie O'Flaherty* | 869 | |||||||||||||||
| Fianna Fáil | Máire Geoghegan-QuinnTD | 808 | 816 | 822 | 848 | ||||||||||||
| Fianna Fáil | Michael Leahy (politiel Leahy) | 796 | 806 | 812 | 855 | ||||||||||||
| Fine Gael | Fintan Coogan | 735 | 737 | 743 | 749 | 753 | 754 | 770 | 870 | ||||||||
| Fine Gael | Pádraic McCormack | 486 | 487 | 489 | 492 | 492 | 492 | 497 | 523 | 545 | 559 | 595 | 673 | 884 | |||
| Fianna Fáil | Henry O'Connor* | 420 | 427 | 433 | 453 | 472 | 484 | 494 | 500 | 501 | 540 | 601 | 626 | 662 | 671 | ||
| Workers' Party | Liz Hackett | 412 | 413 | 425 | 431 | 431 | 431 | 461 | 482 | 484 | 542 | 589 | 709 | 744 | 754 | ||
| Fine Gael | Pascal Walsh | 328 | 330 | 331 | 336 | 336 | 336 | 358 | 396 | 403 | 424 | 449 | 487 | ||||
| Independent | Brendan Holland* | 317 | 318 | 323 | 327 | 327 | 329 | 339 | 353 | 359 | 410 | 541 | 589 | 660 | 698 | ||
| Independent | John Francis King* | 282 | 284 | 303 | 307 | 309 | 309 | 328 | 334 | 336 | 378 | ||||||
| Labour | Peter Kenny | 271 | 271 | 293 | 295 | 295 | 296 | 379 | 390 | 392 | 396 | 420 | |||||
| Independent | Sheila Jordan | 224 | 225 | 230 | 234 | 236 | 237
| ||||||||||
| Fine Gael | Marie Dennis | 219 | 221 | 225 | 228 | 229 | 230 | 241 | |||||||||
| Labour | Pat O'Sullivan | 199 | 201 | 225 | 225 | 225 | 225 | ||||||||||
| Fianna Fáil | Uiris O Ceadegh | 125 | 127 | 128 | |||||||||||||
| Labour | Paddy Naughton | 120 | 121 | ||||||||||||||
| Electorate: 15,706 Valid: 6,611 (42.51%) Spoilt: 65 Quota: 827 Turnout: 6,676 | |||||||||||||||||
South Ward
| Party | Candidate | FPv% | Count | |||||||
|---|---|---|---|---|---|---|---|---|---|---|
| 1 | 2 | 3 | 4 | 5 | 6 | 7 | ||||
| Fine Gael | John Mulholland | 844 | ||||||||
| Fianna Fáil | Martin Connolly* | 671 | 671 | 705 | 721 | 734 | 766 | 802 | ||
| Fianna Fáil | Gerry Molloy* | 532 | 533 | 585 | 609 | 656 | 709 | 757 | ||
| Fine Gael | Pat McNamara* | 525 | 530 | 535 | 564 | 598 | 666 | 781 | ||
| Labour | Noreen Robin | 221 | 222 | 225 | 234 | 250 | 297 | |||
| Independent | Gary O Lochlainn | 161 | 162 | 168 | 189 | 237 | ||||
| Independent | Odran O'Leary | 154 | 155 | 163 | 179 | |||||
| Independent | John Francis King* | 115 | 115 | 119 | ||||||
| Fianna Fáil | Frances Quigley | 113 | 113 | |||||||
| Electorate: 6,909 Valid: 3,336 (48.72%) Spoilt: 30 Quota: 835 Turnout: 3,366 | ||||||||||
West Ward
| Party | Candidate | FPv% | Count | ||||||||
|---|---|---|---|---|---|---|---|---|---|---|---|
| 1 | 2 | 3 | 4 | 5 | 6 | 7 | 8 | ||||
| Workers' Party | Jimmy Brick | 911 | |||||||||
| Fianna Fáil | Bobby MolloyTD | 638 | 658 | 689 | 704 | 731 | 746 | 951 | |||
| Fianna Fáil | Michéal Ó hUiginn* | 596 | 604 | 629 | 640 | 667 | 698 | 832 | |||
| Fine Gael | Angela Lynch-Lupton | 533 | 538 | 540 | 600 | 628 | 650 | 681 | 705 | ||
| Labour | Senator Michael D. Higgins* | 531 | 559 | 563 | 574 | 614 | 783 | 835 | |||
| Fianna Fáil | Mary Byrne* | 417 | 426 | 435 | 446 | 476 | 488 | ||||
| Fine Gael | J.J. McDonagh | 390 | 391 | 409 | 496 | 532 | 571 | 607 | 630 | ||
| Labour | Joe Murray | 255 | 273 | 277 | 284 | 317 | |||||
| Fine Gael | Martin O'Connell | 223 | 227 | 228 | |||||||
| Independent | Tom Browne* | 213 | 226 | 232 | 244 | ||||||
| Independent | William Lambe | 90 | 94 | ||||||||
| Electorate: 11,042 Valid: 4,797 (43.77%) Spoilt: 36 Quota: 800 Turnout: 4,833 | |||||||||||
External links
- Irishelectionliterature
- Department of the Environment, Ireland (28 January 2010). "Local elections, 1985 : election results and transfer of votes in respect of each county, and county borough council : and election statistics relating to all local authorities" (PDF). Department of the Environment. Retrieved 28 October 2019.
This article is issued from Wikipedia. The text is licensed under Creative Commons - Attribution - Sharealike. Additional terms may apply for the media files.